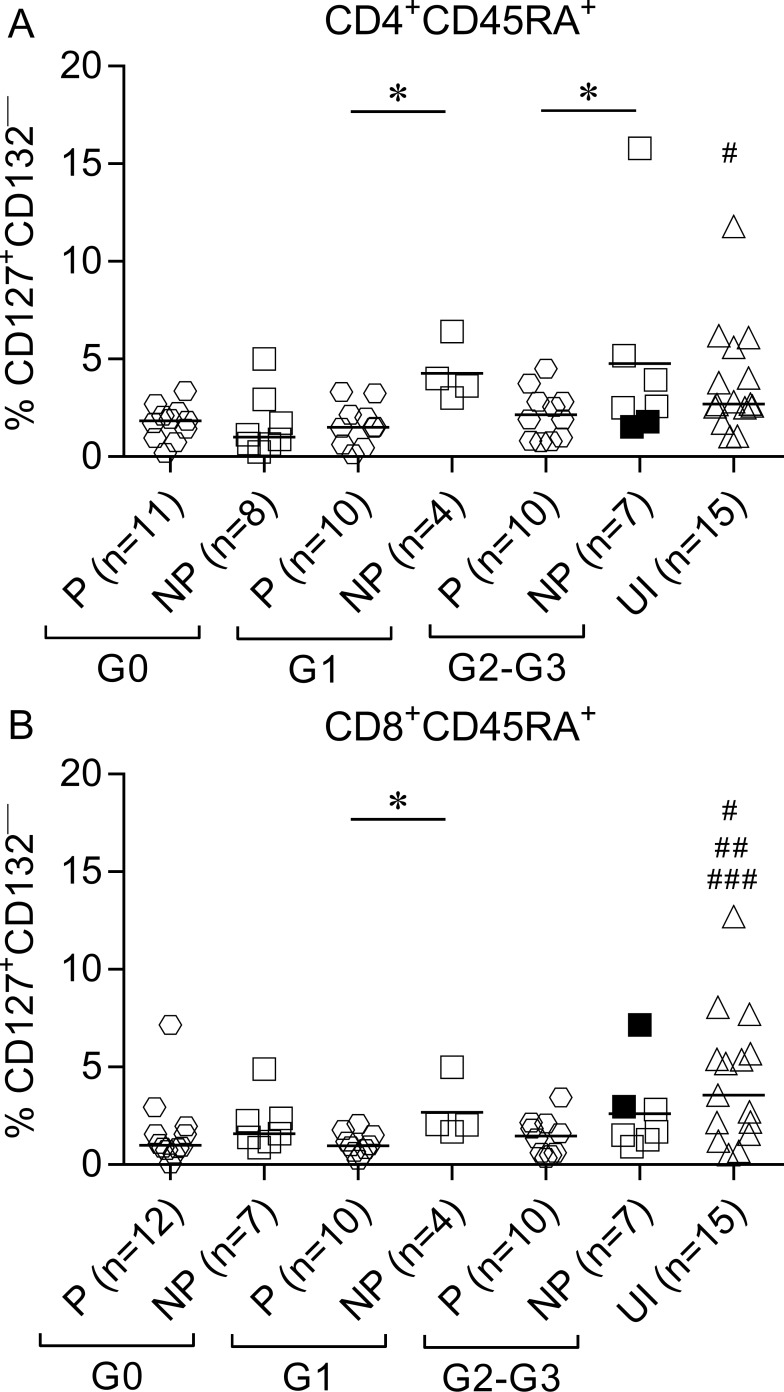
Fig 2. Decreased frequency of recent thymic emigrants in IFN-γ producers.
PBMCs were stained with FV510, CD45RA, CD8, CD4, CD127, and CD132 monoclonal antibodies and analyzed using flow cytometry. Each symbol represents the proportion of CD4+CD45RA+CD127+CD132—(A) or CD8+CD45RA+CD127+CD132—(B) T-cell populations from IFN-γ producers (P) and IFN-γ nonproducers (NP), as classified according to ELISPOT responses as defined in Materials and Methods. Median values are indicated as horizontal lines. Black symbols indicate subjects treated with benznidazole. Comparison between P and NP for each clinical group and uninfected subjects were performed using ANOVA followed by Bonferroni’s multiple comparisons test. * p ≤ 0.05. (A) # p ≤ 0.05 compared with P G0, NP G0, P G1 and P G2-G3; (B) # p ≤ 0.05 compared with P G2-G3; ## p ≤ 0.01 compared with P G0; ### p ≤ 0.01 compared with P G1.

