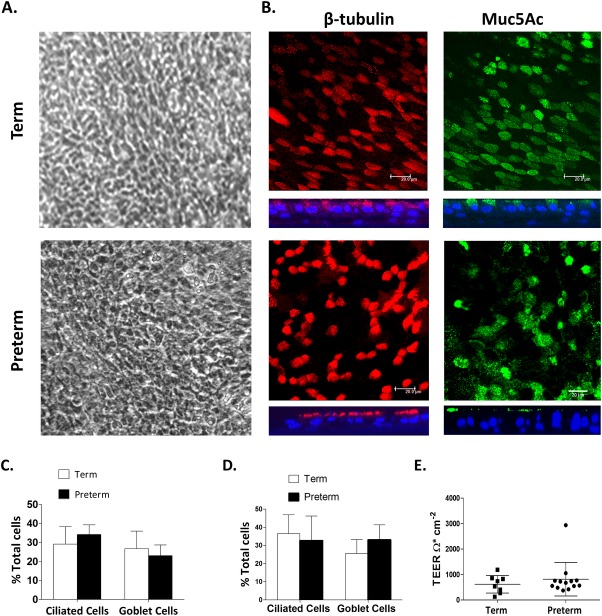
Fig 1. Morphology and differentiation status of newborn term and preterm WD-PNEC cultures.
Cultures were monitored by (A) phase-contrast microscopy (magnification x20) or (B) confocal microscopy after staining for β-tubulin (ciliated cell marker) (red), Muc5Ac (goblet cell marker) (green), or nuclei (DAPI) (blue). For (B), square panels represent en face images, whereas rectangular panels represent orthogonal sections, with the apical side at the top (magnification x63, with x1.5 digital zoom, bar = 20 μm). (C) Transwell cultures from term and preterm donors (n = 4 each) were fixed and stained for ciliated or goblet cells. Images from 5 fields/Transwell were taken at magnification x60 and ciliated, goblet cell and total DAPI+ cell numbers were counted using fluorescent microscopy. The % ciliated and goblet cells were determined relative to total DAPI+ cell numbers. Data are presented as mean (±SD). (D) Transwells cultures were trypsinized, contents fixed onto slides by smearing or use of cytospin funnels, as described, and stained for ciliated (anti–β-tubulin) and goblet (anti-Muc5Ac) and total DAPI+ cells (n = 9 term, n = 10 preterm). Ciliated and goblet cell numbers were expressed as a percentage of the total DAPI+ cell numbers. Data presented as mean (±SD). (E) Transepithelial electrical resistances (TEER) of neonatal term- and preterm-derived WD-PNECs. Measured by EVOM epithelial voltometer and presented as mean (±SD) Ohm.cm-2.

