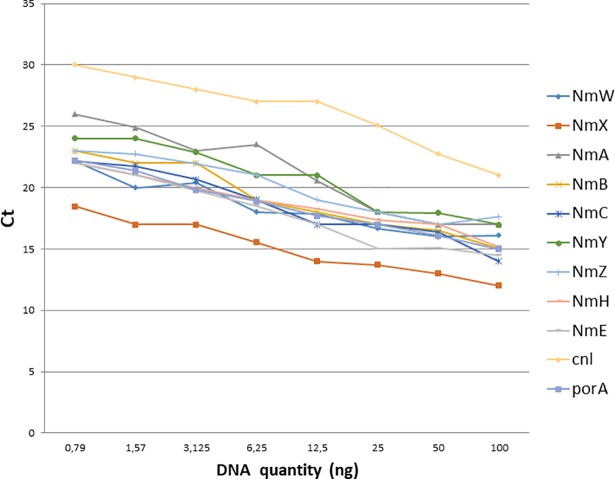
Fig 2. qPCR standard curves.
Eight two-fold dilutions of DNA from each positive control were performed and tested in a qPCR assay with appropriate primers and probes. The Ct observed for each dilution is plotted against the DNA concentration demonstrating a decrease in Ct with increased DNA concentration and detection for all genogroups with a threshold of 30. sodC was empirically tested later and demonstrated the same threshold (data not shown).

