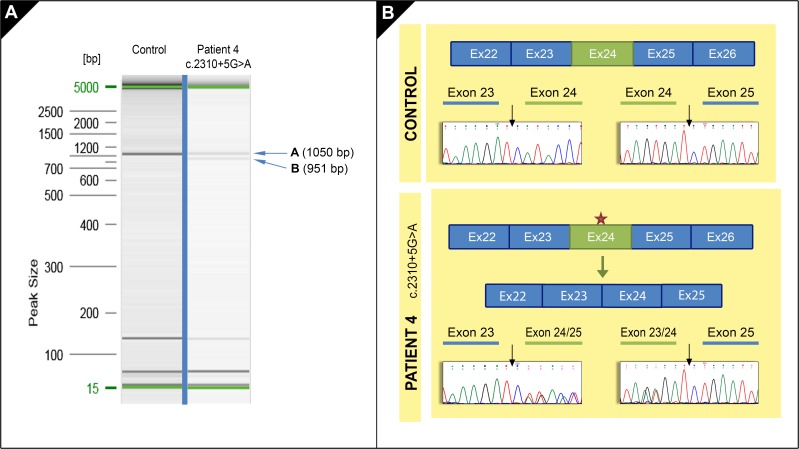
Fig 2. Splicing effects of NEB variant c.2310+5G>A.
A. RT-PCR products obtained in patient 4 (band A and B) and in control sample (band A) are shown in this electrophoresis gel. B. Diagrams show the exons distribution in a cDNA fragment in a control sample and the effect of NEB variant (red star) in patient 4. Electropherograms show the NEB cDNA sequences in control and patient 4. In control, forward sequences show the junction in exons 23–24 and exons 24–25. In patient 4, forward sequence shows the junction in exon 23 and the overlapping exon 24/25; complementary reverse sequence shows the junction in the overlapping exons 23–24 and exon 25 suggesting the exon 24 skipping.

