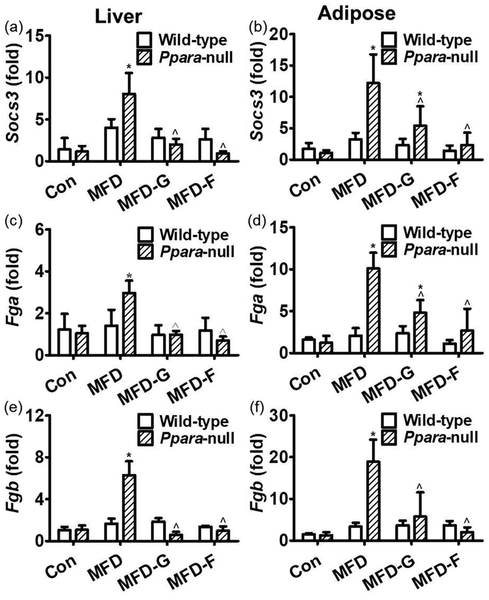
Figure 7.
differential expressions of STAT3 target genes between two mouse lines. (a, b) Socs3 mRNA levels in the liver and adipose tissues respectively. (c, d) Fga mRNA levels in the wild-type and Ppara-null mice respectively. (e) Fgb mRNA in the liver tissues of wild-type and Ppara-null mice respectively. (f) Fgb mRNA in the adipose tissues of the wild-type and Ppara-null mice respectively. The mRNA levels were measured and normalized by 18S rRNA. The mRNA levels in the vehicle-treated control mice were set as 1 and the results expressed as mean ± SD (n=5, *: compared with the WT-Con or KO-Con groups respectively; ^: compared with the WT-MFD or KO-MFD groups respectively).

