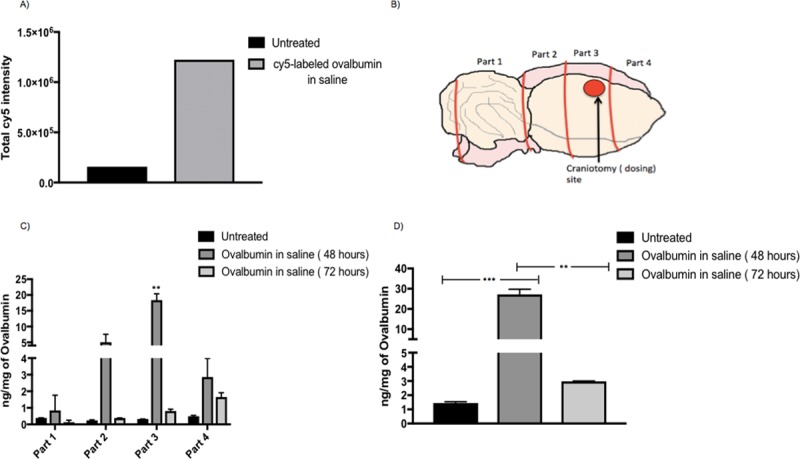
Fig 3. Qualitative and Quantitative uptake of cy5-labeled ovalbumin and ovalbumin in saline in rat brain using mucosal engrafting technique.

(A) Imaging cytometry quantified data from the four selected regions for untreated and Cy5-labeled ovalbumin in saline treated rats (n = 1) using equation total Cy5 intensity = area of Cy5 in selected region in each section * total Cy5 intensity in each selected region in each section. (B) Rat brain cut into 4 equal parts for ELISA with part 3 being the craniotomy site. (C) Ovalbumin detected by ELISA for treatment groups: Untreated (n = 2), ovalbumin saline 48 hours (n = 2), ovalbumin saline 72 hours (n = 2) in the 4 isolated parts of the brain. A 2-way 3 x 4 between and within subjects Anova indicated a significant overall interaction (**** p<0.0001, F (6,9) = 35.75) between different parts (4 brain parts) of the brain and the different treatment groups (untreated, ovalbumin in saline 48 and 72 hours). Post hoc tukey’s tests were further applied to determine differences in ovalbumin uptake in different brain parts. Significant group effects were only found in part 3 where Ovalbumin in saline 48 hours showed significantly greater uptake as compared to untreated rats (** p = 0.0011, DF = 3) and ovalbumin in saline 72 hours(** p = 0.0012, DF = 3). (D) Total ovalbumin (four parts combined) detected by ELISA for treatment groups: Untreated ovalbumin saline 48 hours, ovalbumin saline 72 hours. Ordinary between subjects one way Anova with Tukey’s tests was applied. Ovalbumin in saline (48 hours) showed significantly greater uptake as compared to untreated (*** p = 0.0009, DF = 3) and ovalbumin in saline (72 hours) (** p = 0.0011, DF = 3). A sample size of n = 2 was used for each treatment group.
