
Fig 5. Quantitative uptake of ovalbumin cationic LiG in rat brain using mucosal engrafting technique.
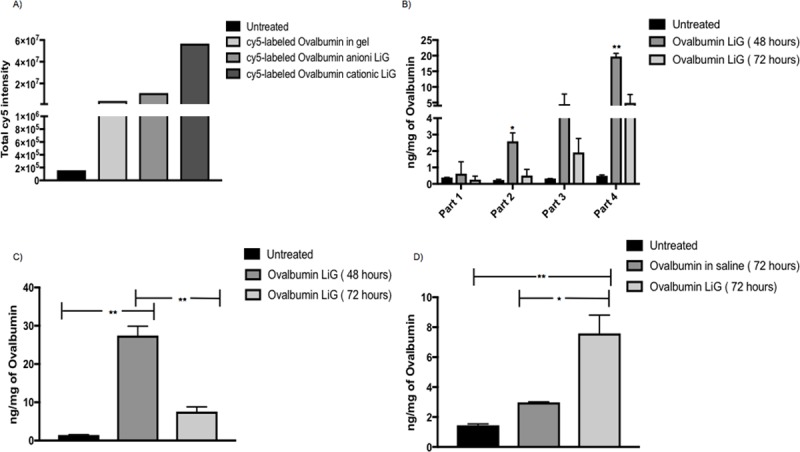
(A) ICYTE quantified data from the four selected regions for untreated, Cy5- labeled ovalbumin in Pluronic F-127 gel, Cy5-labeled ovalbumin anionic LiG and Cy5-labeled ovalbumin cationic LiG (n = 1) using equation total Cy5 intensity = area of Cy5 in selected region in each section * total Cy5 intensity in each selected region in each section. (B) Ovalbumin detected by ELISA for treatment groups: Untreated (n = 2), ovalbumin LiG 48 hours (n = 2), ovalbumin LiG 72 hours (n = 2) in the 4 isolated parts of the brain. A 3 x 4 between and within subjects 2 way Anova was applied and a significant overall interaction (**** p<0.0001, F (6,9) = 20.15) was found between different parts (4 brain parts) of the brain and the different treatment groups (untreated, ovalbumin in LiG 48 and 72 hours). A post hoc tukey’s test was further applied to determine difference in ovalbumin uptake in different brain parts. Ovalbumin LiG 48 hours shows significant uptake in part 2 as compared to untreated (* p = 0.0154, DF = 3) and ovalbumin LiG 72 hours (* p = 0.0217, DF = 3). Ovalbumin LiG 48 hours also shows significant uptake in part 4 as compared to untreated (** p = 0.0028, DF = 3) and ovalbumin LiG 72 hours (**p = 0.0059, DF = 3). (C) Total Ovalbumin detected (four parts combined) by ELISA for treatment groups: Untreated (n = 2), ovalbumin LiG 48 hours (n = 2), ovalbumin LiG 72 hours (n = 2). Ovalbumin LiG (48 hours) shows significant uptake as compared to untreated (** p = 0.0010, DF = 3) and ovalbumin LiG (72 hours) (** p = 0.0022, DF = 3). (D) Ovalbumin LiG (72 hours) shows significant uptake as compared to untreated (** p = 0.0065, DF = 3) and ovalbumin in saline (72 hours) (* p = 0.0147, DF = 3). A sample size of n = 2 was used for each treatment group.