. 2018 Nov 21;7:e39756. doi: 10.7554/eLife.39756

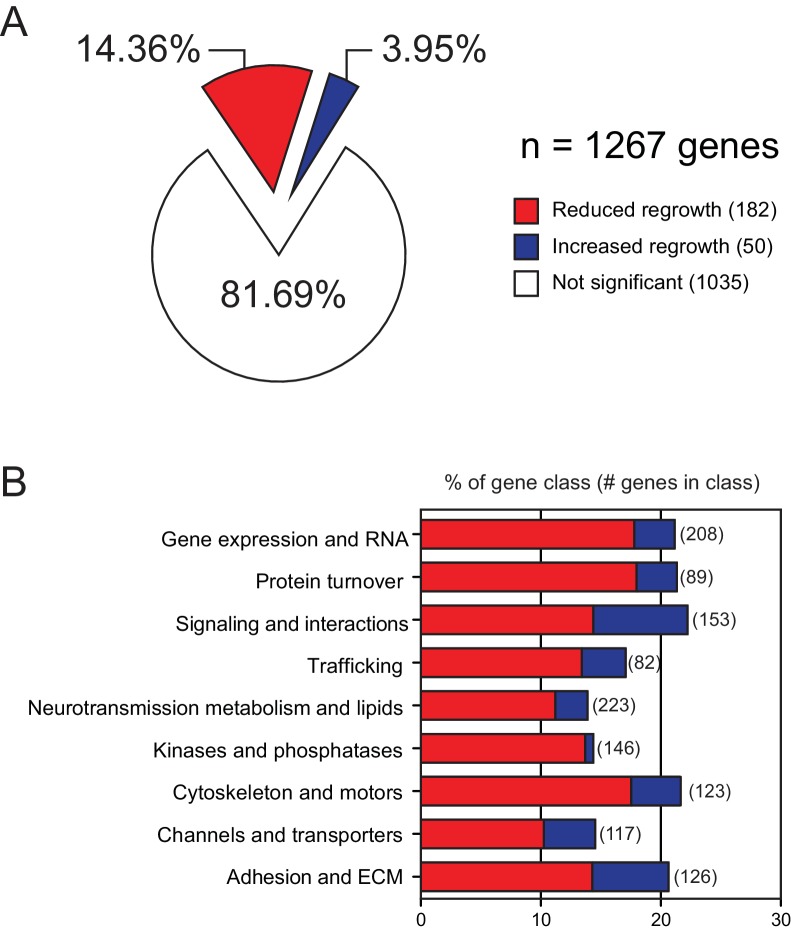
Figure 1. Overview and results of expanded axon regrowth screen.

(A) Pie chart showing fraction of genes screened displaying significantly reduced or increased regrowth at 24 hr. Right: representative inverted grayscale images of PLM 24 hr post-axotomy in wild type (black box), and mutants with reduced (red boxes) or increased regrowth (blue boxes). Orange arrowhead, site of axotomy. (B) Distribution of reduced/increased regrowth mutants among nine functional or structural gene classes, shown as percentage of genes in each class. See Figure 1—source data 1 for lists of genes in each class.

Figure 1—source data 1. List of screened genes, reference alleles, and the functional categories.
DOI: 10.7554/eLife.39756.006

Figure 1.

Figure 1—figure supplement 1. The overview and results of axon regrowth screen combined with our previous study.

Figure 1—figure supplement 1.

(A) Pie chart showing combined genes from both screens (Chen et al., 2011)(this work) displaying significantly reduced or increased regrowth at 24 hr. (B) Distribution of reduced/increased regrowth mutants among nine functional or structural gene classes, shown as percentage of genes in each class.

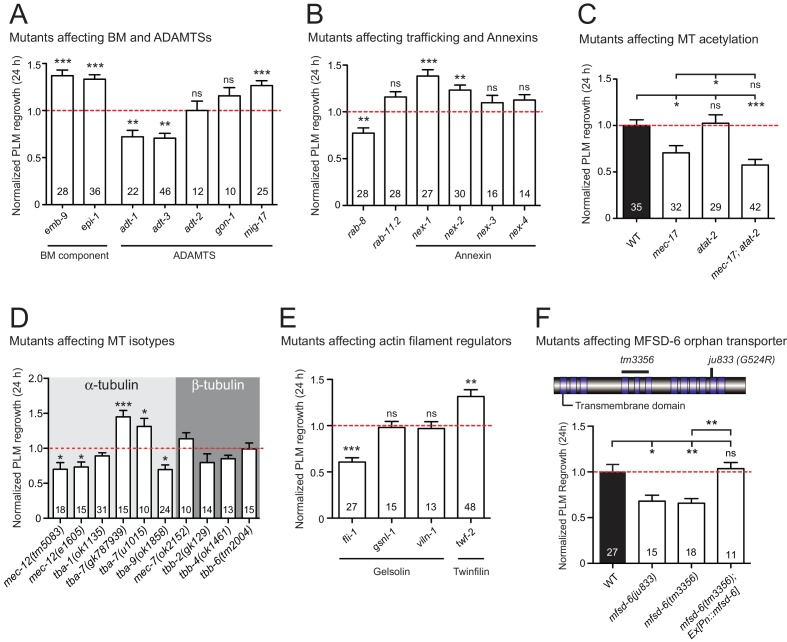
Figure 1—figure supplement 2. Mutants affecting multiple biological processes required for normal axon regrowth.

Figure 1—figure supplement 2.

(A–E) Normalized PLM axon regrowth 24 hr post-axotomy in mutants affecting: (A) components of basement membrane (BM) and ADAMTS, (B) components of trafficking and Annexins, (C) microtubule acetyltransferases, (D) microtubule isotypes, and (E) actin filament regulators. Statistics, Student’s t-test with same day controls. (F) Normalized PLM axon regrowth 24 hr post-axotomy in mutants affecting mfsd-6 mutants. Pan-neuronal expression of MFSD-6 [Pn::mfsd-6] in mfsd-6(tm3356) animals rescues axon regeneration. Statistics, one-way ANOVA followed by Tukey’s multiple comparison tests. Left: MFSD-6 protein structure. Loss-of-function alleles are indicated above (tm3356, deletion; ju833, missense point mutation). Blue rectangles represent transmembrane domains. Data are shown as mean ±SEM. n, number of animals shown within columns. ns, not significant. *p<0.05; **p<0.01; ***p<0.001. In Figure 1—figure supplement 2D, tba-1, tbb-4, and tbb-6 (Chen et al., 2011) are included for comparison.
Figure 1—figure supplement 2—source data 1. Each data point in all graphs.
DOI: 10.7554/eLife.39756.005