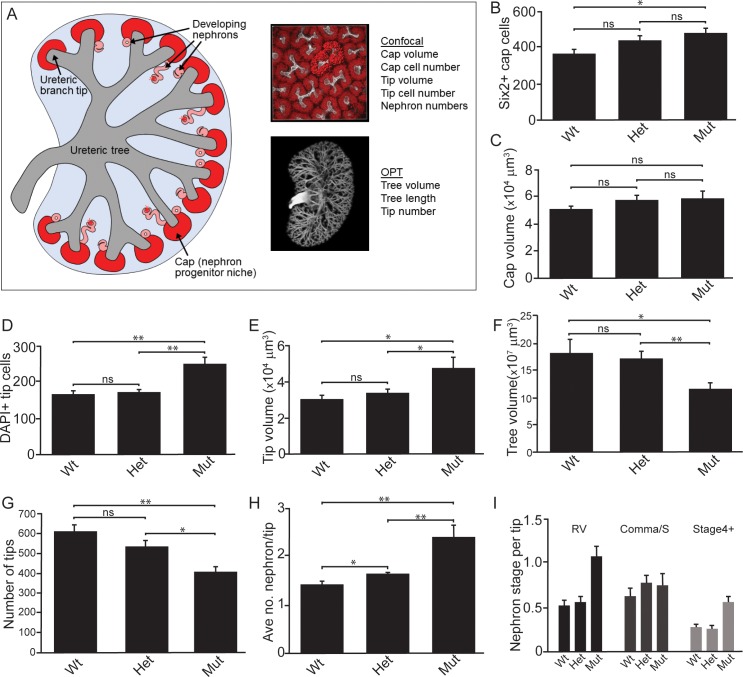
Figure 3. Quantitative analyses reveal significant alterations to niche metrics and accelerated nephrogenesis in Wnt11tm1a/tm1a kidneys.
(A) Schematic of the developing kidney highlighting the niche and structure metrics quantified after imaging by either confocal or optical projection tomography (OPT). E15.5 wholemount immunostains were performed with α-Six2 and α-pan cytokeratin antibodies and kidneys subsequently imaged by confocal microscopy for analyses in B-E, H, and I or OPT for analyses in F-G. (B) The number of Six2 +nephron progenitors per niche were quantified and reveal an increase in Wnt11 mutants. (C) The overall volume of each nephron progenitor niche (cap) is not significantly different between wild type and Wnt11 mutants. (D) The number of DAPI +cells were quantified in each cytokeratin +ureteric branch tip niche and were increased in Wnt11 mutants. (E) Ureteric branch tip volumes were measured and are larger in Wnt11 mutants, correlating with the increase in tip number. (F) Ureteric tree volume was quantified and is reduced in Wnt11tm1a/tm1a kidneys. (G) Quantitation of ureteric branch tip number reveals a significant decrease in Wnt11tm1a/tm1a kidneys. (H) The average number of nephrons per ureteric branch tip are increased in Wnt11 mutant kidneys. (J) Classification of the developing nephron structures associated with each tip highlight a bias in Wnt11 mutants towards renal vesicles (RV) and stage 4 + nephrons versus comma/s-shaped bodies. All error bars represent SEM. All significance values were determined by t-test. ns = p > 0.05, * = p < 0.05, ** = p < 0.01, *** = p < 0.001. n = 6 kidneys of each genotype for confocal analyses. N = 8 of each genotype for OPT analyses.


