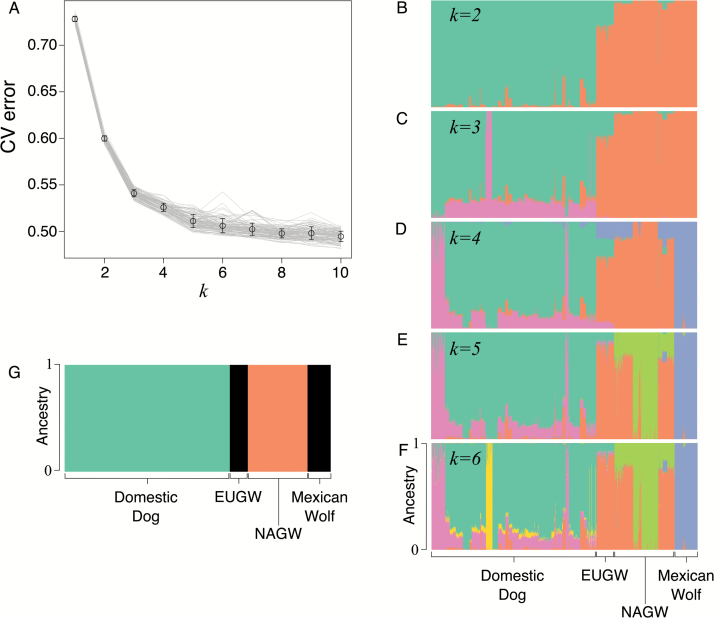
Figure 3.
Results of the population clustering analysis from ADMIXTURE. (A) Cross-validation error for different potential numbers of clusters, k, between 1 and 10. Each line represents a different subsample of an equal number (n = 88) of Mexican wolves, gray wolves, and domestic dogs. (B–F) Ancestry plot across all individuals for k = 2–6. Each vertical bar represents an individual with colors corresponding to the proportion of ancestry in the predefined number of clusters, k. (G) Ancestry plot for the supervised analysis, where Mexican wolves were assigned ancestry to either domestic dog, European gray wolf (EUGW) or North American gray wolf (NAGW) parental populations. See online version for full colors.

