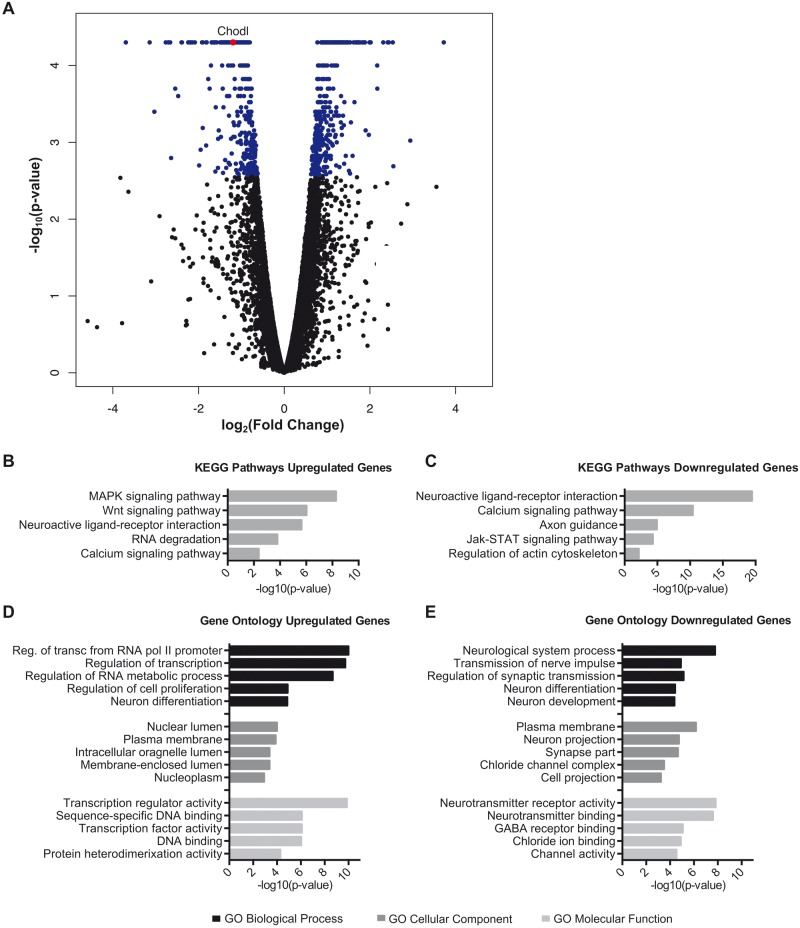
Figure 3.
mRNA transcriptome profiling in SMN knockdown motor neurons. ( A ) Volcano plot of log 2 (fold change) versus –log 10 ( P- value) of all 13,943 genes detected above threshold shows a subset of differentially expressed genes but no change in overall gene expression. Differentially expressed transcripts are indicated in blue, corrected P- value <0.05. The DAVID bioinformatics tool was used to complete Pathway and GO analysis of differentially expressed genes. KEGG pathway analysis shows the most significant biological pathways enriched in the ( B ) upregulated and ( C ) downregulated genes. ( D ) GO analysis of enriched terms in upregulated and ( E ) downregulated genes. Significance was determined using minimum number of hits = 2 and Bonferroni P < 0.05.

