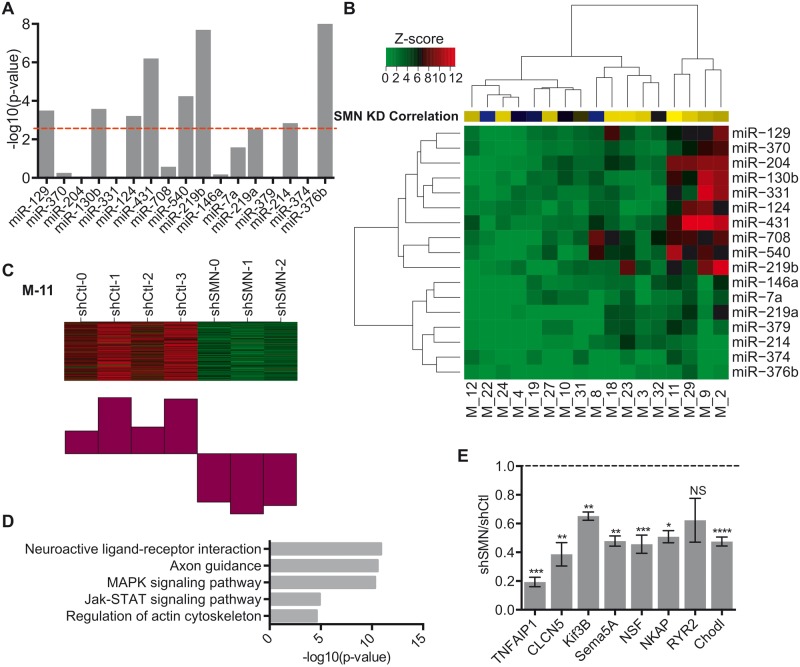
Figure 4.
WGCNA of miRNA effect of co-expressed putative target genes. ( A ) Bar plot of P -values demonstrating the enrichment of PITA targets using GSEA. P -values were transformed using −log 10 and correction for multiple comparisons was performed using a Bonferroni correction P < 0.0025 (red line). ( B ) Heatmap of z -scores for miRNA target enrichment in WGCNA. Yellow–blue Heatmap indicates correlation with SMN knockdown for each module. Interactions with modules were significant at z -score > 3.6 corresponding to P < 0.00017. ( C ) Heatmap and corresponding chart of downregulated gene expression of shCtl versus shSMN RNA-Seq samples in Module-11. ( D ) Bar plots of GO analysis of Module 11 genes. Significance was determined by minimum number of hits = 2 and Bonferroni P < 0.05. ( E ) qRT-PCR of relative mRNA expression of nine putative miR-431 targets in shCtl vs. shSMN. N = 4 from four experiments, * P -value < 0.05, ** P < 0.01, *** P < 0.001, unpaired two-tailed Student’s t -test. Data are represented as mean ± SEM.

