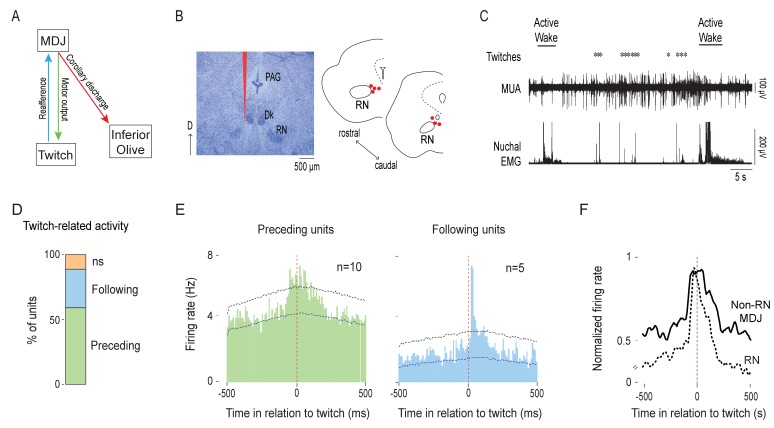
Figure 5. MDJ structures adjacent to the red nucleus exhibit twitch-preceding and twitch-following activity.
(A) Diagram showing anatomical connections of the MDJ regions that lie adjacent to the red nucleus. Proposed pathways conveying motor commands (green line), reafference (blue line), and corollary discharge (red line) are shown. (B) Left: Representative Nissl-stained coronal brain section. Red line is the trace of a DiI-coated electrode placed within the MDJ but outside the RN. Right: Reconstruction of electrode placements (red circles) in the MDJ in two coronal sections across all pups (n = 7). D: dorsal; PAG: periaqueductal gray; Dk: nucleus of Darkschewitsch. (C) Representative recording of rectified nuchal EMG activity and multiunit activity (MUA) in the MDJ during spontaneous sleep-wake cycling. Asterisks denote twitches and horizontal bars denote periods of active wake movements as scored by the experimenter. (D) Stacked plot showing the percentage of twitch-preceding (motor; green) and twitch-following (sensory; blue) units in the MDJ. ns: not significant. (E) Left: Perievent histogram (10-ms bins) showing activity of twitch-preceding MDJ units in relation to twitches. Data are pooled across 10 units and triggered on 2877 twitches. Right: Perievent histogram (10-ms bins) showing activity of twitch-following MDJ units in relation to twitches. Data are pooled across 5 units and triggered on 1382 twitches. Upper and lower confidence bands (p < 0.05 for each band) are indicated by horizontal dashed lines. (F) Perievent histograms (10-ms bins) comparing normalized firing rate in relation to twitch onset for twitch-preceding units in the red nucleus (RN; dashed black line; data from Del Rio-Bermudez et al., 2015) with that of non-RN MDJ units adjacent to the red nucleus (solid black line; redrawn from E, left).


