Figure 6.

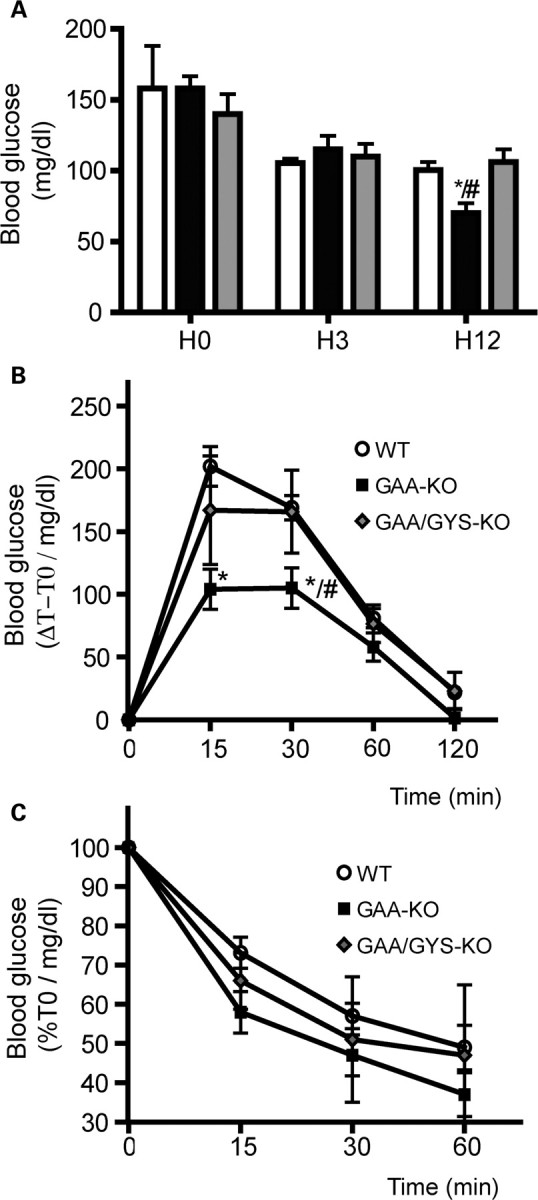
Blood glucose level, glucose and insulin tolerance of 3-month-old mice on a standard diet. Blood glucose level was measured after normal diet (H0), 3 h (H3) or 12 h (H12) of fasting (A). Glucose tolerance test (GTT) (B). Insulin tolerance test (ITT) (C). Values are expressed as the mean ± SEM (n ≥ 3). *P < 0.05 compared with WT mice and #P < 0.05 compared with GAA/GYS1-KO mice.
