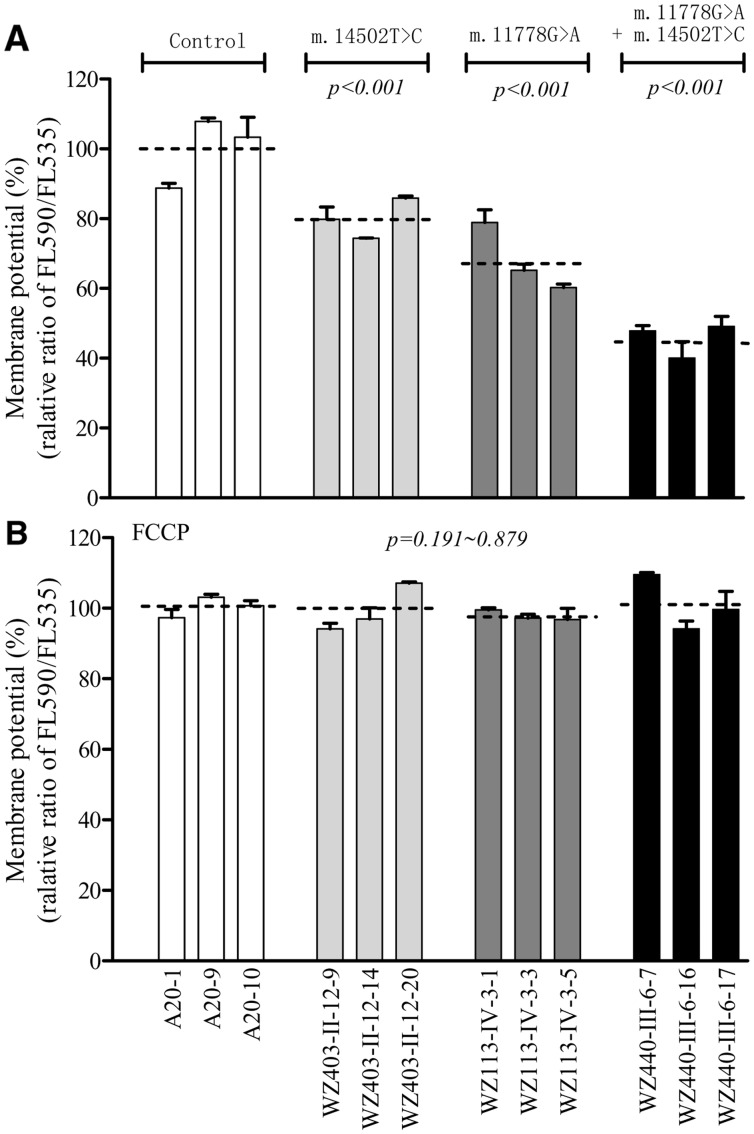
Figure 7.
Mitochondrial membrane potential analysis. The mitochondrial membrane potential (ΔΨm) was measured in mutant and control cell lines using a fluorescence probe JC-10 assay system. The ratio of fluorescence intensities Ex/Em = 490/590 nm and 490/530 nm (FL590/FL530) were recorded to delineate the ΔΨm level of each sample. The relative ratios of FL590/FL530 geometric mean between mutant and control cell lines were calculated to reflect the level of ΔΨm. Relative ratio of JC-10 fluorescence intensities at Ex/Em = 490/530 nm and 490/590 nm in absence (A) and presence (B) of 10µM of carbonyl cyanide 3-chlorophenylhydrazone (FCCP). The average of 3-5 determinations for each cell line is shown. Graph details and symbols are explained in the legend to Figure 2.

