
Figure 5. HLM activity stratified by UGT genotypes.
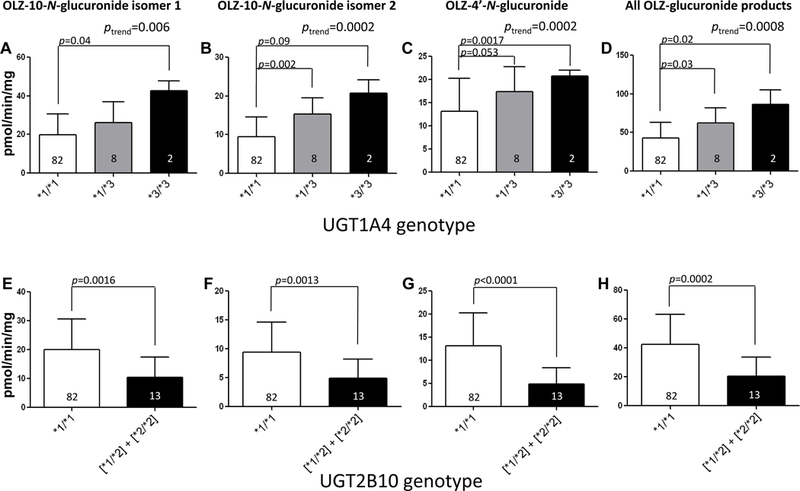
Shown are the levels of OLZ-10-N-glucuronide isomer 1, OLZ-10-N-glucuronide isomer 2, and OLZ-4’-N-glucuronide formation versus UGT1A4 or UGT2B10 genotypes in HLM. Glucuronidation activity assays were performed using 300 μM OLZ and 12.5 µg of HLM protein, and OLZ glucuronides were detected and separated by UPLC as described in the Materials and Methods. Using genomic DNA from the same liver specimens for which HLMs were prepared, UGT1A4 and UGT2B10 genotypes were determined using DNA sequencing and RFLP analysis, respectively. Panels A-D, OLZ glucuronidation in HLM stratified by UGT1A4 genotypes; panels E-H, OLZ glucuronidation in HLM stratified by UGT2B10 genotypes. Panel A and E, OLZ-10-N-glucuronide isomer 1 formation; panels B and F, OLZ-10-N-glucuronide isomer 2 formation; panels C and G, OLZ-4’-N-glucuronide formation; panels D and H, all OLZ-glucuronide product formation. Analysis of OLZ glucuronidation in HLM stratified by UGT1A4 genotypes was performed only for those specimens also exhibiting the wild-type UGT2B10 (*1/*1) genotype (n=92); similarly, analysis of OLZ glucuronidation in HLM stratified by UGT2B10 genotypes was performed only for those specimens also exhibiting the wild-type UGT1A4 (*1/*1) genotype (n=95).