Figure 1.
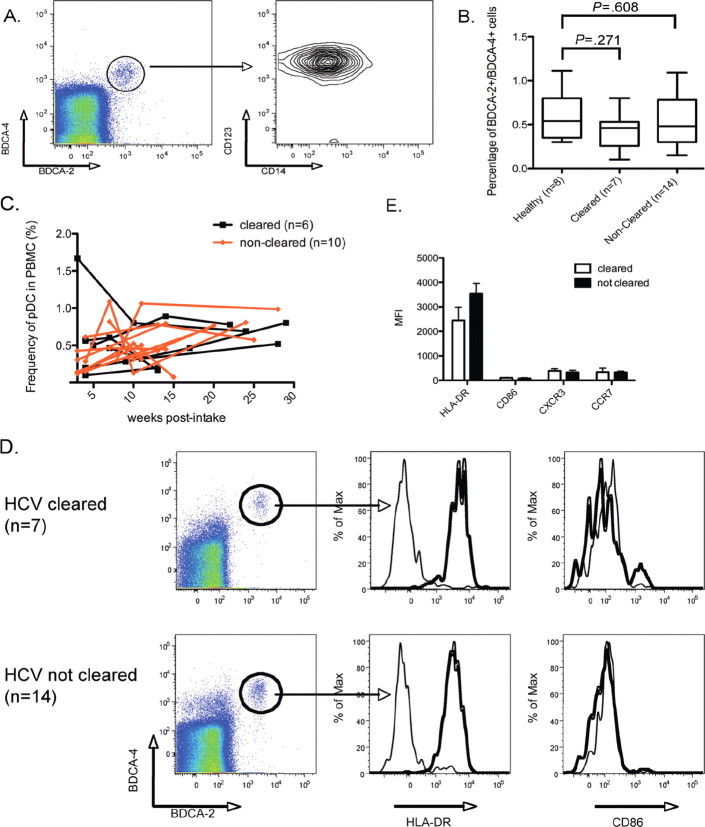
Plasmacytoid dendritic cell (pDC) phenotype and enumeration in acute hepatitis C virus (HCV) infection. A, pDCs are identified on the basis of their expression of BDCA-2, BDCA-4, CD123, and the absence of CD14. B, The percentage of pDCs are plotted for healthy donors (np 8), patients who cleared HCV infection (np 7), and patients developing persistent HCV infection (np 14). Mann-Whitney statistical analysis was used to perform 2-way comparisons for significance. C, Kinentic analysis of pDC frequency in patients with acute HCV genotype 4 infection. Black lines indicate patients who spontaneously cleared HCV (np 6); red lines indicate patients who became persistently infected with HCV (np 10). D, Cytometric analysis of pDC activation markers in patients who have cleared HCV infection and patients who have not cleared HCV infection: HLADR and CD86. Gray histograms indicate staining with an isotype control E, The expression of surface markers, as measured by mean fluorescence intensity (MFI), is shown for patients who cleared HCV infection (white bars) and who did not clear HCV infection (black bars). Error bars indicate 1 standard deviation from the mean. PBMCs, Peripheral blood mononuclear cells.

