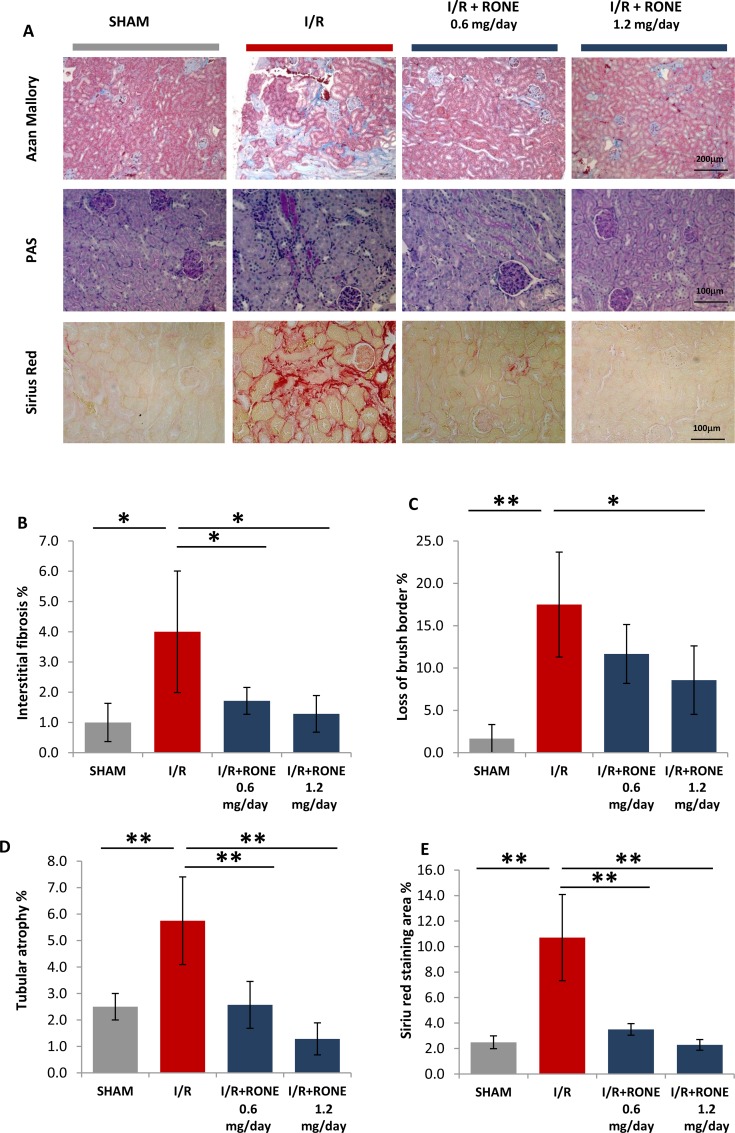
Figure 2. HPSE inhibition ameliorates renal injury and interstitial fibrosis induced I/R.
(A) Representative light microscopy images of Azan-Mallory, PAS and Siriur Red stained sections of the renal cortex from each group (scale bar = 200 μm). Histograms represent quantification of renal injury: (B) interstitial fibrosis (C) loss of brush border and (D) tubular atrophy (blubbing and sloughing of epithelial tubular cells) evaluated by a skilled pathologist in a blinded manner. Value are expressed as percentage of the observed area. (E) Histogram represent quantification of Sirius Red positive area. Values are expressed as mean ± standard deviation; N = 7. **p < 0.001; *p < 0.05.

