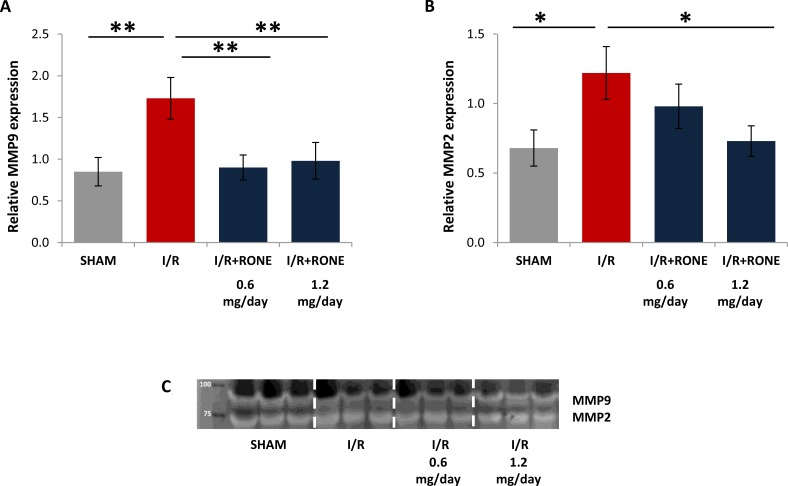
Figure 6. Gene expression of MMPs.
Relative gene expression of (A) MMP-9 and (B) MMP-2 was evaluated by real-time PCR in renal tissue extracts from mice subjected to I/R kidney injury and treated or untreated with RONEPARSTAT. Results were normalized to GAPDH expression. Histograms represent mean ± S.D of two separate experiments performed in triplicate.**p < 0.001; *p < 0.05. (C) Gelatin zymography shows MMP-9 and MMP-2 activity bands in the renal tissue of the different groups of mice.

