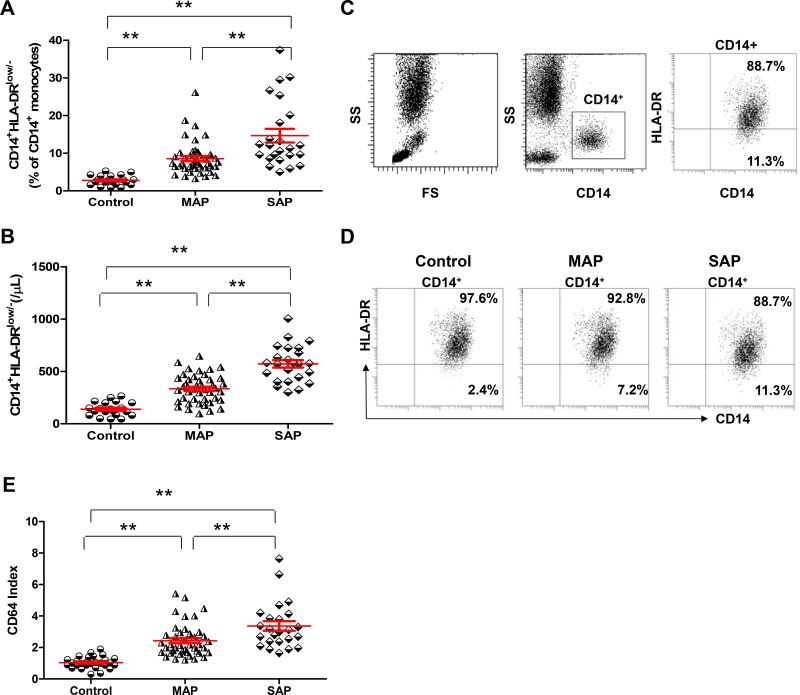
Figure 5. CD14+HLA-DRLow/− cells and CD64 index are elevated in patients with AP compared with healthy individuals.
Graphs show the frequencies (A) and numbers (B) of CD14+HLA-DRLow/− cells from healthy individuals (n = 21), MAP patients (n = 46) and SAP patients (n = 17). (C) Representative flow cytometry plot depicts the gating strategy for CD14+HLA-DRLow/− cells. (D) Representative dot plots of CD14+HLA-DRLow/− cells from one healthy individual, one MAP patient and one SAP patient are shown. (E) Graphs show CD64 Index from healthy individuals (n = 21), MAP patients (n = 46) and SAP patients (n = 17). *P < 0.05, **P < 0.01.

