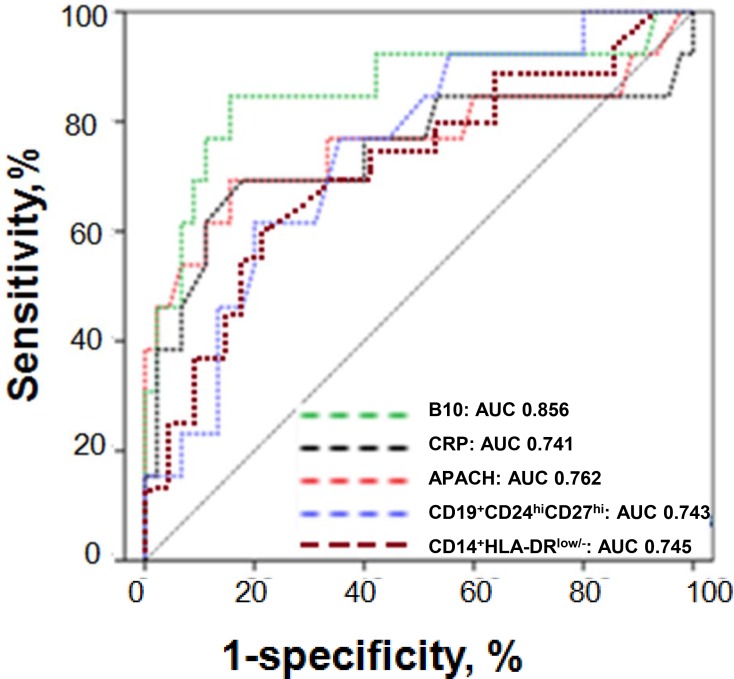
Figure 9. ROC curves for B10 or CD19+CD24hiCD27hi cells in the prediction of SAP.
ROC curves for B10 or CD19+CD24hiCD27hi cells measured within 24 h from the onset of AP in the prediction of SAP in comparison to other laboratory tests associated with AP severity. The selected cut-off values are highlighted, and AUC with 95% confidence intervals and P-values for the difference in the AUC from AUC = 0.5 are shown on the graphs. The values of the AUC for each test are shown on the graph. The diagonal line is the line of no-discrimination.

