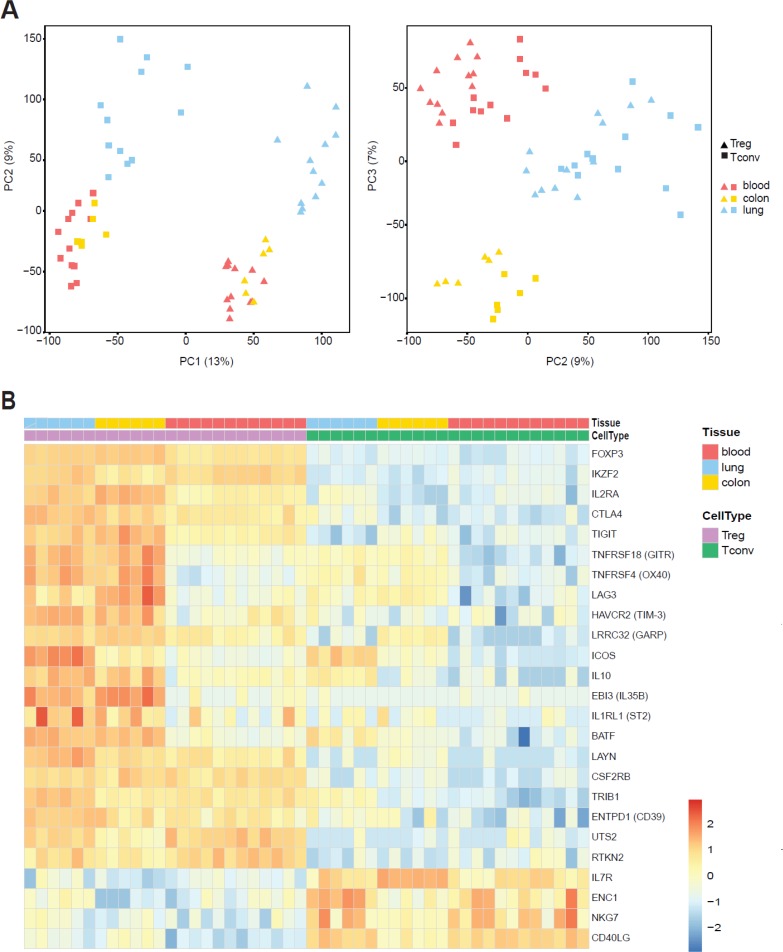
Figure 2. Distinct gene-expression program of tissue-resident Treg cells.
Whole-transcriptome profiling by RNA-seq was performed on Treg and Tconv cells from lung and colon of 6 patients and patient-matched blood samples. (A) Principal-component analysis (PCA) of global gene-expression data for analysed subsets. Each symbol represents a cell population from an individual donor. The first and second principal component is depicted in the left panel and the second and third principal component is in the right panel. (B) Heat map showing normalized expression levels of genes described earlier as Treg-specific or Tconv-specific. Cell populations are reported as a color code in the upper part of the graph, while gene names have been assigned to heat map rows. Data was scaled and centered.

