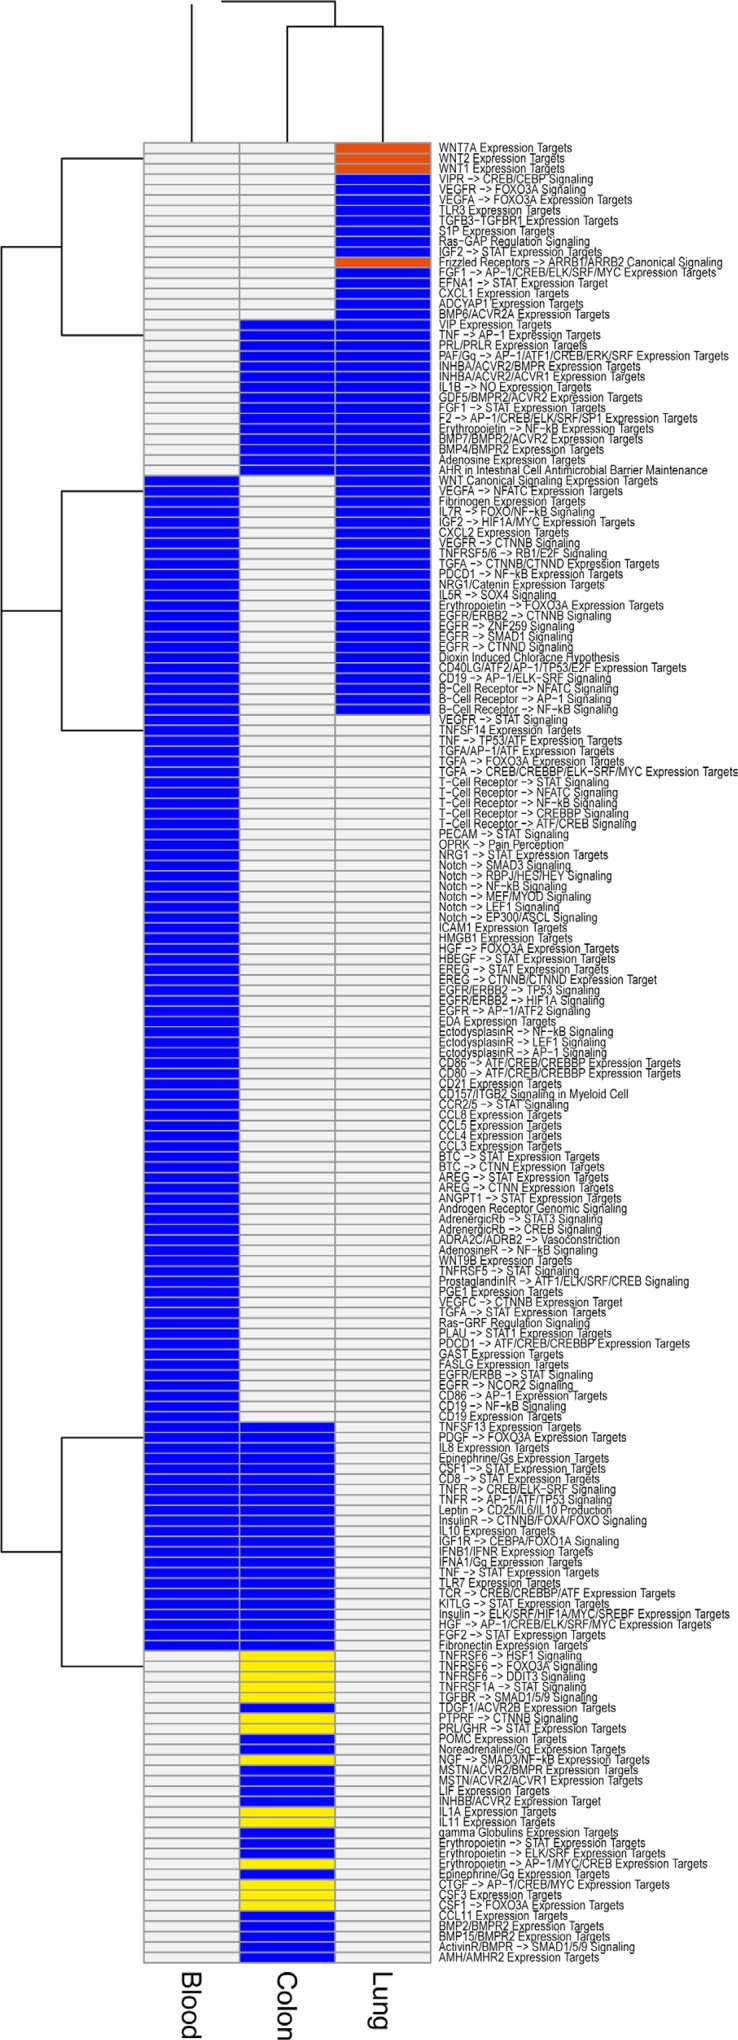
Figure 4. Signal processing enrichment in tissue Tregs.
Pathway Studio® analysis of Signal processing pathways enriched in our Treg data. Analysis was performed for all differentially expressed genes (comparison Treg/Tconv, cut offs FDR < 0.05 & |log2FC| > 2) in lung tissue (n = 618), colon tissue (n = 853), and blood (colon matched blood n = 622, lung matched blood n = 637). The results for the two sets of blood samples were combined (present in at least one = present) for the plot. Signal processing pathways present in all three tissues (lung, colon, and blood) are not shown. Blue color indicate that the pathway is present. Pathways specific for lung highlighted in red are Wnt related and the colon specific pathways in yellow are related to pro-inflammation and apoptosis.

