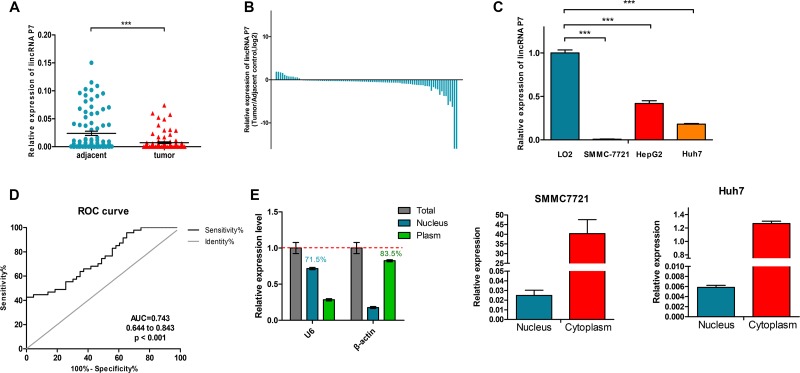
Figure 2. LincRNA P7 expression levels in HCC tissues and cells.
(A) Relative expression levels of lincRNA P7 in tumor tissues compared with adjacent normal tissues (n = 108). LincRNA P7 expression was evaluated by qRT-PCR and normalized to GAPDH expression. (B) Positive values for lincRNA P7 expression indicate a higher level of lncRNA expression in tumor tissue compared with nontumor tissue, while negative values indicate a lower level of lincRNA P7 expression in tumor tissue compared with adjacent tissue. (C) The level of lincRNA P7 expression was lower in HCC cell lines than in the normal liver cell line LO2 (***p < 0.001). (D) The area under the receiver operating characteristic (ROC) curve for the prediction of HCC based on lincRNA P7 expression, which used the corresponding adjacent normal tissues as controls. (E) qRT-PCR analysis of lincRNA P7 in the subcellular fractions of SMMC 7721 and Huh7 cells. U6 and β-actin served as nuclear and cytoplasmic markers, respectively (n = 3).

