
Fig. 1. Phenotype of ZmBx12-overexpressing wheat lines.
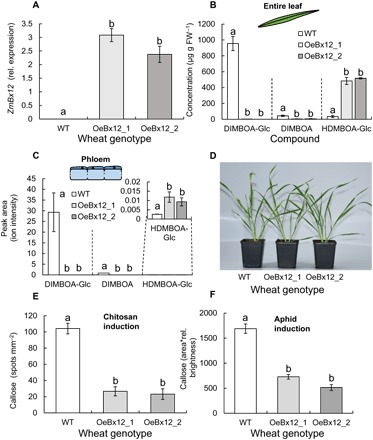
(A) Relative (rel.) expression of the maize DIMBOA-Glc OMT ZmBx12 in wild-type (WT) and ZmBx12-overexpressing plants (n = 3). (B) Major benzoxazinoids in the leaves of the different lines (n = 5). FW, fresh weight. (C) Major benzoxazinoids in the phloem of the different lines (n = 3 to 4). (D) Representative photograph of WT and transgenic lines. (E) Chitosan-induced callose deposition (n = 9 to 12). (F) Aphid-induced callose deposition (n = 23 to 39). Because of irregular shapes and brightness of callose induction spots following aphid attack, area*rel. brightness were used to assess callose deposition. Different letters indicate significant differences between wheat lines [analysis of variance (ANOVA) followed by Holm-Sidak post hoc tests, P < 0.05]. Photo credit for (D): B. Li and T. Züst, University of Bern.