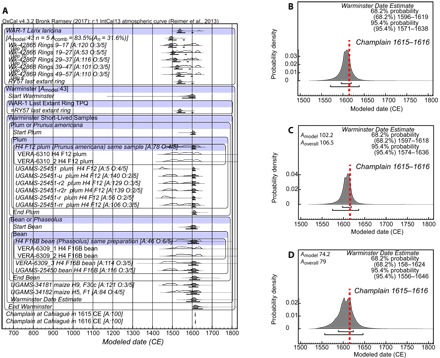
Fig. 2. 14C-derived chronology for the Warminster site.

(A) The OxCal (32, 35) dating model for the Warminster site Phase with TPQ from a tree ring–sequenced 14C wiggle match on a wood post (36) and then the 14C dates on short-lived plant material, using the IntCal13 14C dataset (34), with the dates on the same plum and bean samples combined (table S5A). The nonmodeled calibrated dating probabilities are indicated by the gray distributions; the modeled probabilities are shown by the black distributions. The lines under the modeled distributions indicate the 68.2% highest posterior density (hpd) and 95.4% hpd ranges. OxCal agreement indices (A, Amodel, and Aoverall) >60 indicate good agreement between the 14C data and the model. O values are posterior/prior probabilities that the date is an outlier. (B) The modeled Date estimate for the Warminster site from (A). (C) Date estimate from an alternative model treating each date on the plum and bean samples as independent estimates within independent “plum” and “bean” sub-Phases (table S5B). No outliers, but one low agreement date (A:5 = UGAMS-25451). (D) As (C) but excluding UGAMS-25451. Amodel and Aoverall values are now >60. The dates of Champlain’s visit to Cahiagué, 1615–1616, are indicated in each panel.
