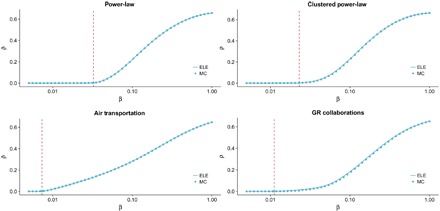
Fig. 1. Incidence of the epidemic process ρ as a function of the infection probability β.

We show the incidence level for the ELE model (solid lines) and for Monte Carlo (MC) simulations (circles). The theoretical epidemic threshold calculated using Eq. 19 is marked with a vertical line. We have made use of two synthetic and two real networks: two scale-free networks (top) with an exponent of 3, one of them with high clustering coefficient; the world air transportation network; and the network of scientific collaborations in the field of general relativity (GR). We have set the recovery rate for all the networks to μ = 0.5 (see Methods for the description of the networks and the details of the MC simulations).
