
Figure 3. Concentration curves and kinetic analysis for (R)-NNAL- and (S)-NNAL-Gluc formation with microsomes from UGT2B7, UGT2B17, UGT1A9 and UGT2B10 overexpressing cells.
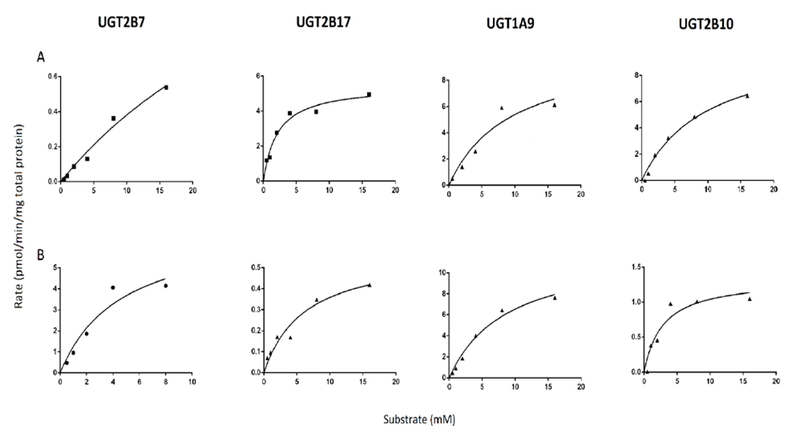
Glucuronide formation assays were performed at 37 °C for 1 h using 15-20 μg total UGT-overexpressing cell microsomal protein as described in the Materials and Methods. Rate, Vmax and Vmax/KM values are expressed per mg of total protein. Representative curves are shown and kinetic analysis was performed in three independent experiments.