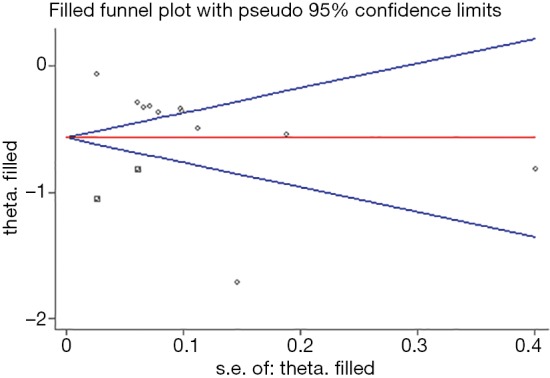
Figure 4.

Funnel plot of the surgeon volume-outcomes in spine surgery. Statistic test (Begg, P=0.062; Egger, P=0.005) suggested potential publication. And then, ‘trim and fill’ method suggested that two ‘missing studies’ with negative results may be the possible source of publication bias. However, the overall pooled effect estimate remained steady when these ‘missing studies’ were added in the current meta-analysis (13 studies; OR, 0.57; 95% CI: 0.43–0.75). Circle: eleven included studies. Square: two “missing studies” from the estimation of trim and fill method. SE, standard error.
