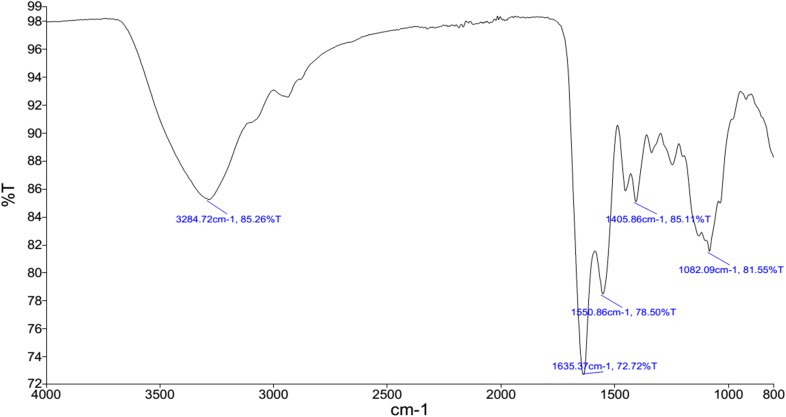
Fig. 1.
FTIR spectrum of the EPS isolated from Halorubrum sp.TBZ112 (KCTC 4203 and IBRC-M 10773). The band at 3284.72 cm−1 might be attributed to the stretching of hydroxyl group as well as water adsorption. The band at 1635 cm−1 was a result of the C=O stretching. The ether group from the EPS was indicated at 1082.09 cm−1 absorption band. The absence of symmetric strong band in the frequency of 1150 cm−1 and asymmetric strong band in the frequency of 1200 cm−1 (Pavia et al. 2008) demonstrated that the EPS from Halorubrum sp. TBZ112 most likely did not include S=O group

