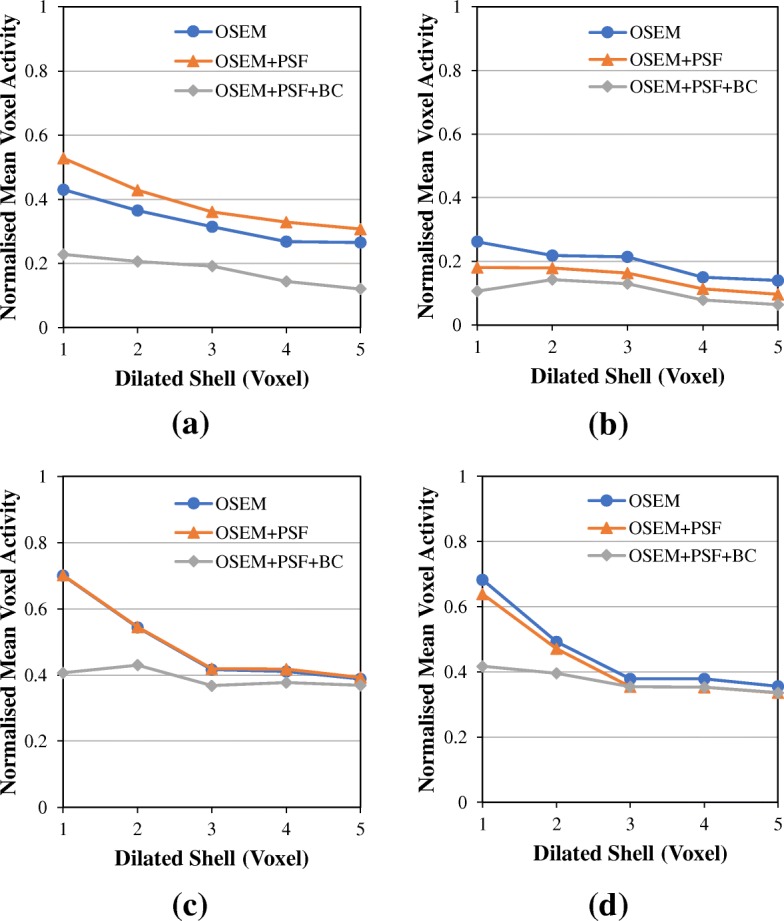
Fig. 12.

Validating the effect and correction of spill-in effect using patient data. This figure shows the normalised mean values within the dilated shells surrounding the spleen at a 3 full iterations with no post-filter, b 20 full iterations with no post-filter, c 3 full iterations with a 4-mm Gaussian post-filter and d 20 full iterations with a 4-mm Gaussian post-filter. The mean activity values in the dilated shells were normalised with the mean activity in the liver
