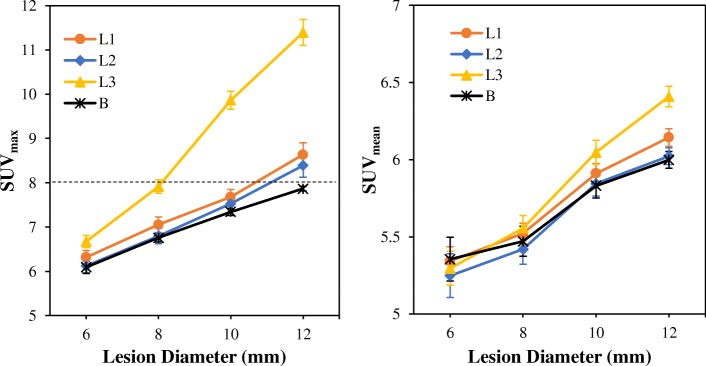
Fig. 5.
The spill-in and spill-out effects as a function of lesion size for lesions L1–L3 and background lesion B at bladder SUV 55.5. The SUVs were obtained from OSEM reconstructed images using the mean SUVs of all noise realisations at 30 full iterations with a 4-mm Gaussian post-filter. The error bars are the standard error of the mean (SEM) while the dashed horizontal line denotes the true simulated lesion SUV. Background lesion B is the reference which shows the expected lesion SUV without spill-in effect

