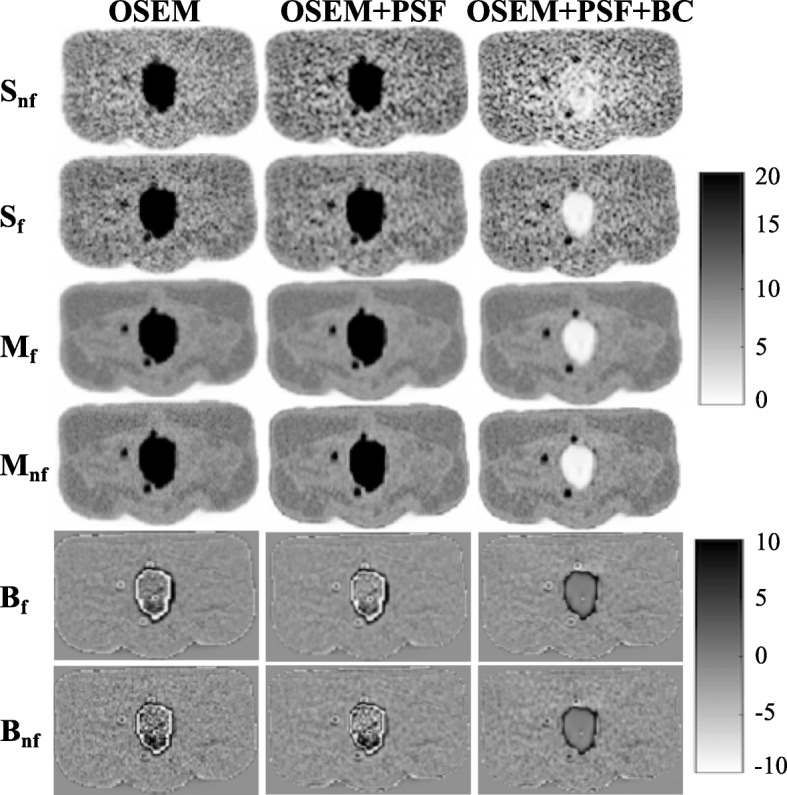
Fig. 7.

Images showing improvement in lesion detection and reduction of bias around bladder edges with the correction technique. This is shown for bladder SUV 55.5 and lesion diameter 10 mm at 20 full iterations. Sf and Snf are the single noise realisation images with and without filtering, respectively, while Mf and Mnf are the mean images from 20 noise realisations with and without filtering respectively. Bf and Bnf are the bias images (i.e. difference between the mean image and the true simulated image) with and without filtering respectively. The bias image in OSEM+PSF+BC was estimated by first removing the bladder from the true simulated image
