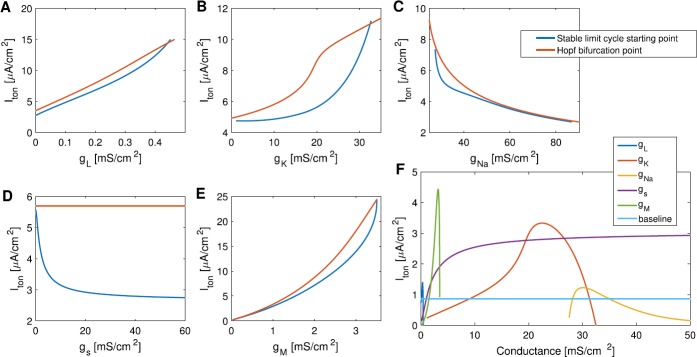
Fig. 11.
A–E: The change in the starting point of the stable limit cycle and the Hopf bifurcation point as parameters , , , , and change. The vertical distance between the blue and red curves is the size of the bistability window. F: The size of the bistability window as parameters , , , , and change. The baseline at around 0.86 μA/cm2 is the size of the bistability window with default parameter values. Changes in , , and increase the bistability window size significantly. Increasing the maximal M-current conductance to approximately 3.2066 mS/cm2 has the most dramatic effect

