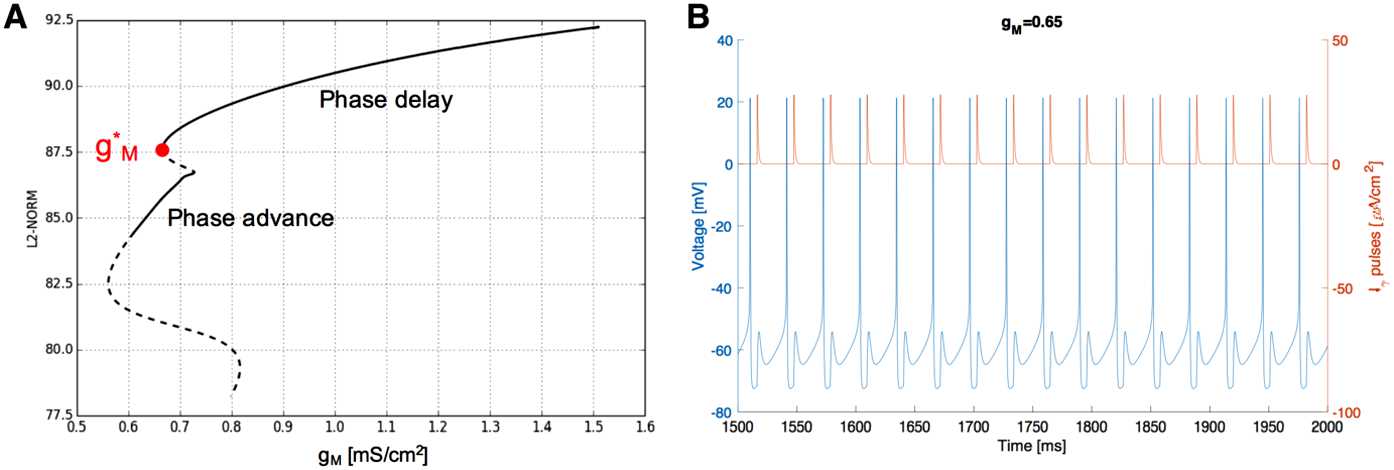
Fig. 14.

A: Bifurcation diagram of the stable limit cycle of (10) with respect to parameter . Stable limit cycles are represented by solid curves, while unstable limit cycles are drawn as dashed curves. The stable limit cycle at mS/cm2 continues as decreases and terminates at mS/cm2 (phase delay limit cycles, top branch of stable limit cycles). The bottom branch of stable limit cycles corresponds to phase-locking when the I-cell fires consistently before the E-cell (phase advance limit cycles). B: Simulation of (10) with units when mS/cm2. The stable limit cycle is on the bottom branch of the stable limit cycles in the bifurcation diagram in A. The I-cell does phase-lock to the E-cell. However, I-cell consistently spikes before the E-cell does, not immediately after the E-cell’s spikes. The voltage trace of the I-cell is in blue. The external pulses are in red
