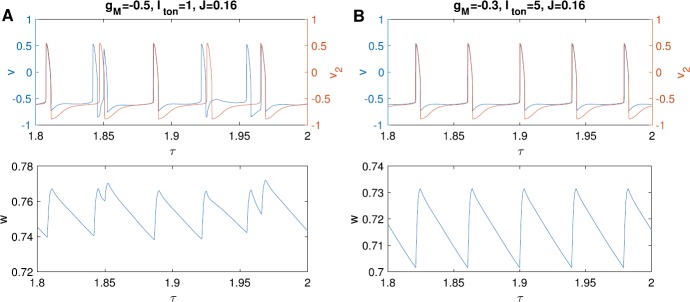
Fig. 16.
Simulations results of (10) with to approximate the singular orbit. A: Using parameters , , , before the I-cell spikes. B: Using parameters , , , before the I-cell spikes. Top row: voltage traces of the I-cell (blue) and the E-cell (red). Bottom row: the trace of M-current gating variable w

