Fig. 7.

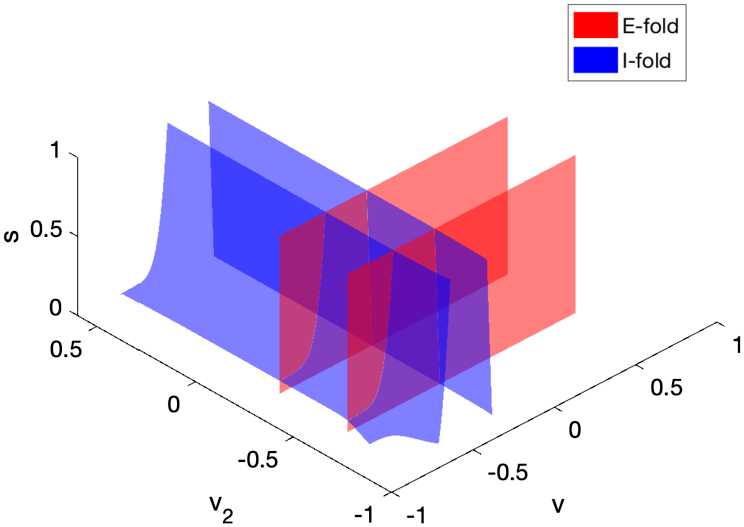
Approximated position of the fold L of the network model (10). Both branches and have two sheets. The sheets at lower v, values represent the firing thresholds of the I-cell and E-cell, respectively

Approximated position of the fold L of the network model (10). Both branches and have two sheets. The sheets at lower v, values represent the firing thresholds of the I-cell and E-cell, respectively