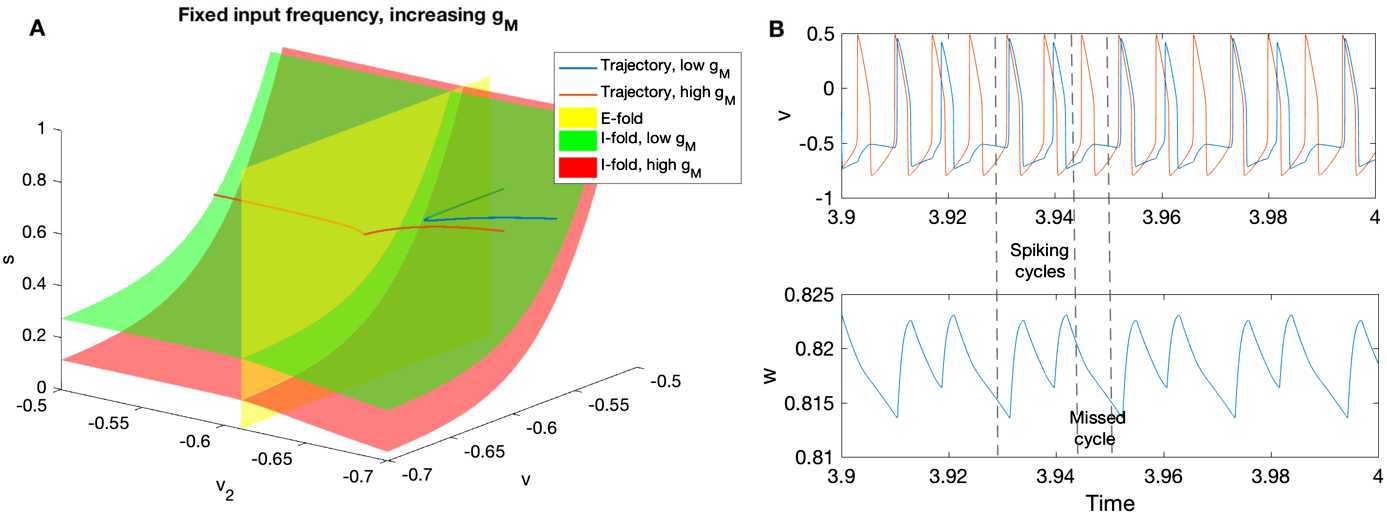
Fig. 8.

A: Increasing moves the I-fold in the positive v direction, equivalent to raising the I-cell threshold. The singular trajectories are approximated by setting in (10). Folds are approximated by equations (18), and fixing for the green (low ) I-fold, and for the red (high ) I-fold. Other parameters used to generate this figure can be found in Appendix 4. B: The voltage traces of the I-cell (blue) and E-cell (red) are shown in the top panel. Parameter J is increased to 20 to show sparse entrainment. Other parameters are the same as the high case in A. The M-current gating variable w is shown in the bottom panel. It builds up during spiking cycles and decays during missed cycles
