Figure 3.
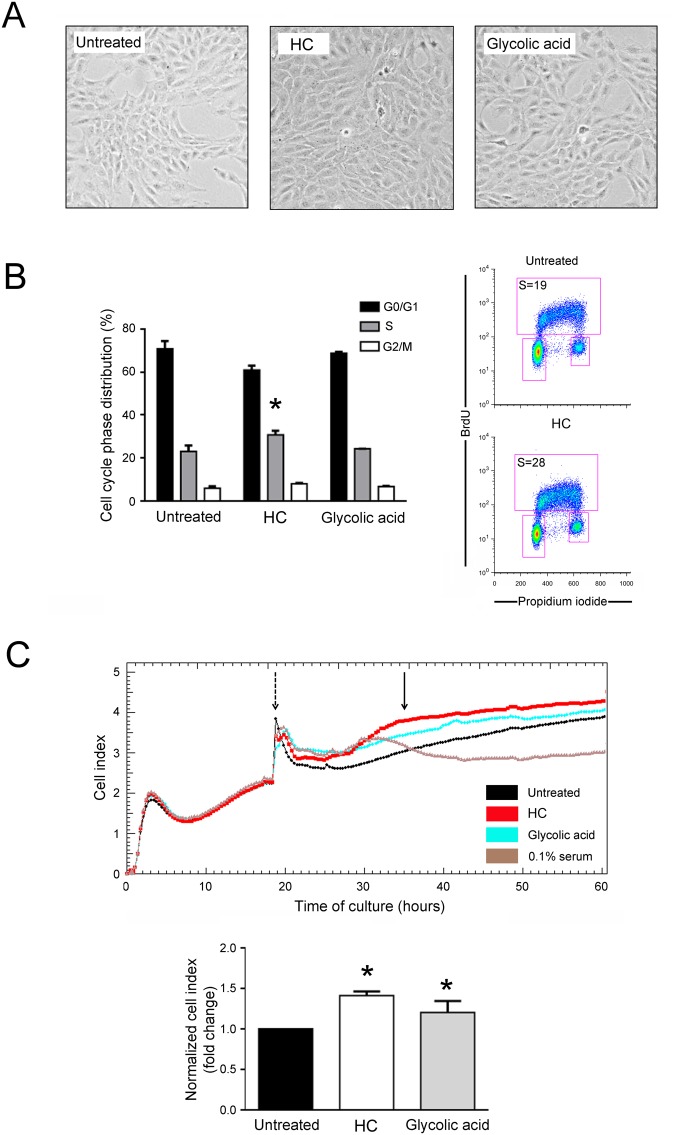
HelixComplex promotes cellular proliferation. Cultures of fibroblasts were exposed to high dose of HelixComplex (400 µg/ml) for up to 48 hours. In (A) representative images taken by light microscopy of monolayers of fibroblasts untreated or treated with HelixComplex or glycolic acid (0.1 mM) at 48 hours. Magnification 100x. In (B) cell distribution in the different phases of the cell cycle was calculated from the flow cytometric dot plots after BrdU/PI staining of cultures after 36 hours of treatment and was expressed as percentage of the total population. Representative flow cytometric dot plots of cell-cycle profiles are shown: the rectangles represent the cells in the different (G0/G1, S, G2/M) phases of the cell cycle and the percentage of cells in S-phase is indicated for each treatment. In (C) fibroblasts were treated with HelixComplex or glycolic acid and monitored for proliferation with the xCELLigence system. Upper panel: representative plot of Cell index of fibroblasts treated with HelixComplex or glycolic acid. Fibroblasts grown in starvation medium (0.1% serum) were used as negative control of proliferation. Dashed arrow indicates the time in which treatments were added to cell cultures. Arrow indicates the time in which Cell index was quantified. Lower panel: Cell index quantification at 16 hours after treatment (normalized relative to 0 hour) and expressed as fold of modulation with respect to untreated cultures set at 1. In (B,C) data are reported as the mean ± SD of results from at least three independent experiments. The asterisk indicates p < 0.05 respect to untreated cultures. HC: HelixComplex.

