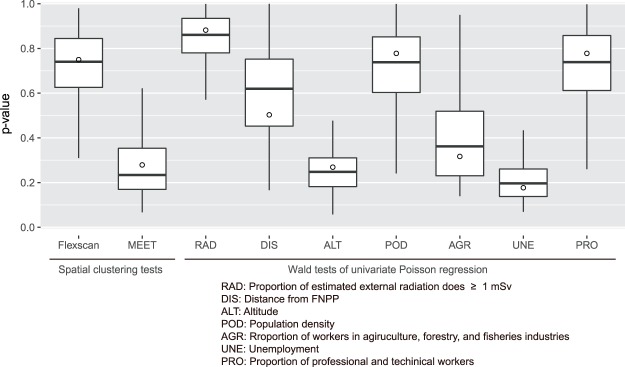
Figure 4.
Result of sensitivity analysis of the effects of undiagnosed positive examinees at primary examination on p-values of the spatial analysis. Box-plots were drawn by 100 Monte Carlo simulation runs for p-value of the most likely cluster computed by flexibly shaped spatial scan statistics, the adjusted p-value of maximised excess events test (MEET), and Wald tests of univariate Poisson regression about the coefficient of the explanatory variable. The white circles represent the p-values obtained from the analysis not considering the effects of undiagnosed positive examinees (the same numbers reported in Figs 2 and 3 and Table 1).

