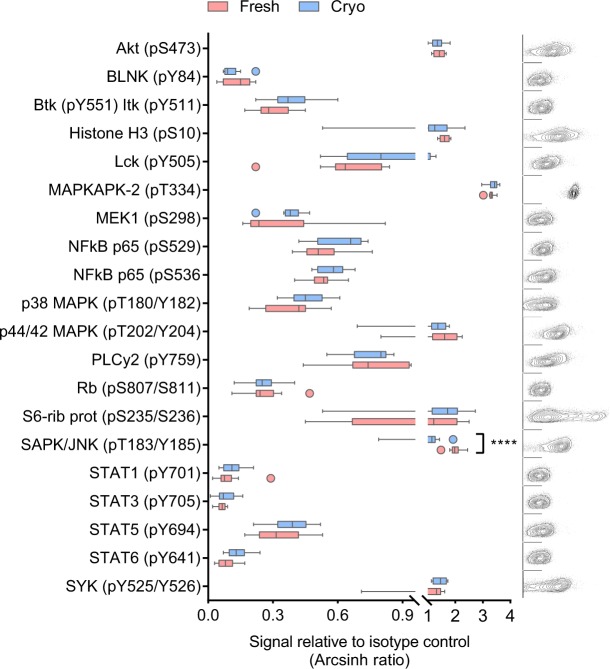
Figure 1.
Characterization of basal signaling patterns in freshly isolated and cryopreserved primary B cells. B cells were isolated from healthy blood donors and analyzed immediately (n = 10; fresh) or after cryopreservation (n = 10; cryo). The cells were fixed, permeabilized and stained with anti-CD19 surface marker and phospho-specific antibodies as described in Methods. The fluorescence signals were detected by flow cytometry and analyzed in Cytobank. The basal fluorescence signals were measured relative to IgGκ isotype control and shown as arcsinh ratio (box-and-whisker; outliers are indicated separately). Statistical significance was calculated by a paired t-test with correction for multiple comparisons using the Holm-Sidak’s method, ****p < 0.00001. The plots to the right show raw flow cytometry data from one representative donor (fresh). Each plot corresponds to the protein shown in the aligned box-and-whisker plot, with phospho-protein (x-axis) plotted against FSC-A (y-axis).

