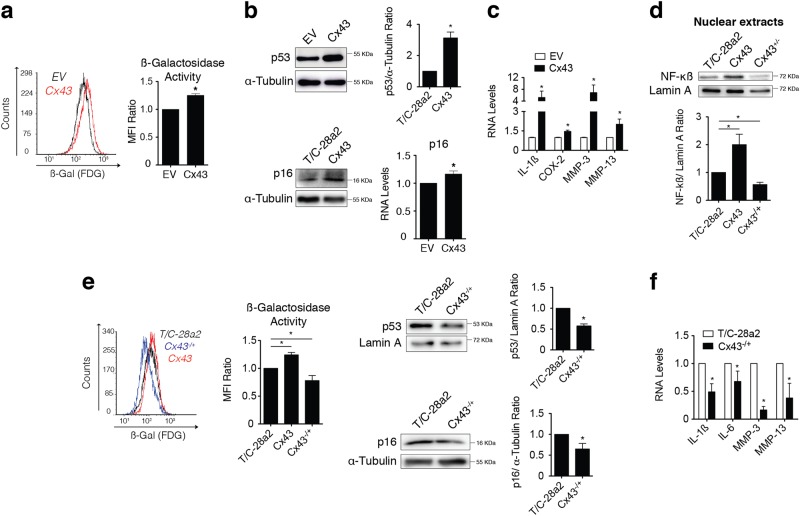
Fig. 4. Dedifferentiation induced by Cx43 activates senescence and prolongs inflammation and remodelling.
a Flow cytometry analysis with the FDG substrate showing elevated levels of SAβG activity in Cx43-overexpressing T/C-28a2 cells (red) versus empty vector (EV) control cells (black) (n = 5; mean ± s.e.m.; *P < 0.05; Mann–Whitney test). b Western blot (n = 2; mean ± s.e.m.; *P < 0.05; Student’s t-test) and RT-qPCR (n = 4; mean ± s.e.m.; *P < 0.05; Mann–Whitney test) showing that overexpression of Cx43 increased p53 and p16 levels in T/C-28a2 chondrocytes. c Analysis of IL-1β, COX-2, MMP-3 and MMP-13 mRNA levels using real-time PCR in T/C-28a2 cells overexpressing Cx43 (n = 2–4; normalized to HPRT-1 and represented as mean ± s.e.m.; *P < 0.05; Mann–Whitney test). d Nuclear levels of NF-κB detected by western blot in the T/C-28a2 cell line overexpressing Cx43 (Cx43) and in the T/C-28a2 heterozygous for Cx43 (Cx43−/+), compared to the non-transfected cell line (T/C-28a2). Lamin A was used as a nuclear loading control (n = 2, mean ± s.e.m.; *P < 0.05, **P < 0.01; Student’s t-test). e Downregulation of Cx43 in T/C-28a2 cells (CRISPR-Cas9 knockdown) decreased SAβG (blue) (n = 3–4; mean ± s.e.m. *P < 0.05, **P < 0.01; one-way ANOVA), and increased of p53 and p16 protein levels, detected by western blot (n = 2–3, mean ± s.e.m.; *P < 0.05; Student’s t-test). f Analysis of IL-1β, COX-2, MMP-3 and MMP-13 mRNA levels in the T/C-28a2 heterozygous for Cx43 (Cx43−/+). Data were normalized to HPRT-1 (mean ± s.e.m. n = 3–4; *P < 0.05; Mann–Whitney test)

