Fig. 3.
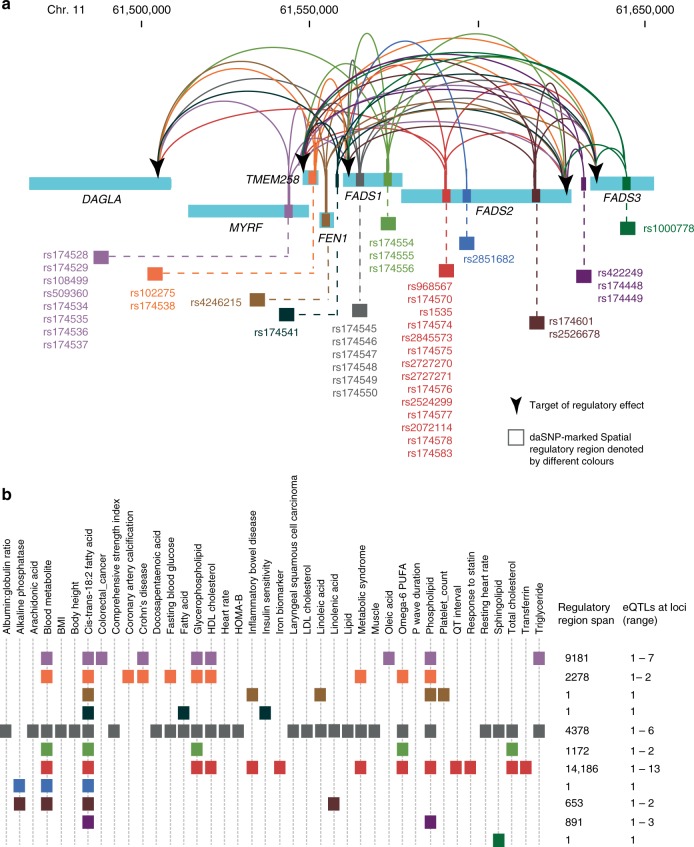
Spatial eQTL-eGene interactions central to the fat metabolism cluster. a Transcript levels for genes located within Chr. 11: chr11:61447905–61659017 are associated with eQTLs located in clusters across the 283 kb locus. For simplicity, we grouped eQTLs according to separation in the linear sequence such that they are located in different genes, or are separated by ≤5 kb. Genomic locations are from human genome Hg19 and the eQTL-eGene interaction analysis used GTEx v4 (18/10/2016). b Phenotype-associated eQTLs are localised or dispersed across the FADS1 locus. eQTLs associated with cis-trans-18:2 fatty acid levels are the most dispersed. eQTLs rs174545-50 are associated with the most phenotypes. The regulatory region span (in bp) includes the spatial eQTL SNPs in the group. eQTL SNPs are coloured according to the putative regulatory regions in a

