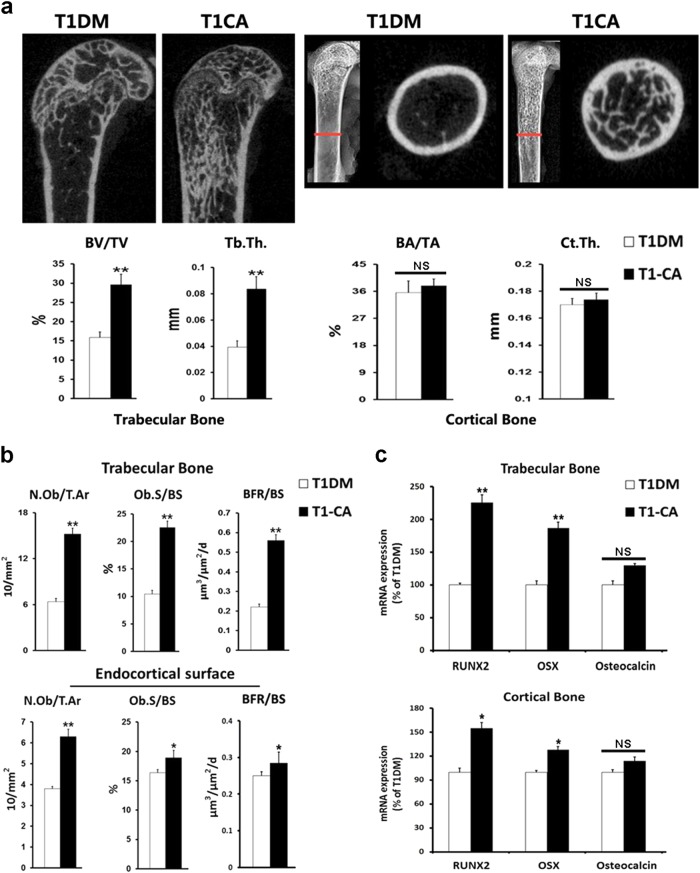
Fig. 3. Osteoblastic activation of β-catenin in T1DM mice led to greater extent of bone mass increment and increase of osteogenic activities in trabecular bone compared with cortical bone.
a Representative Micro-CT longitudinal reconstructed images of distal femur and cross-sectional images of the femoral diaphysis. BV/TV, Tb.Th (Trabecular bone), BA/TA, and Ct.Th (Cortical bone) are shown. n = 9/control, 7/T1DM. b Static and dynamic histomorphometric analyses in the trabecular bone and endocortical surface of the femur. n = 9. c mRNA expression levels of osteoblast markers in trabecular and cortical bone. n = 8. Data are expressed as the mean ± SD. *P < 0.05, **P < 0.01 versus T1DM group by an unpaired t-test. NS not significant, P > 0.05

