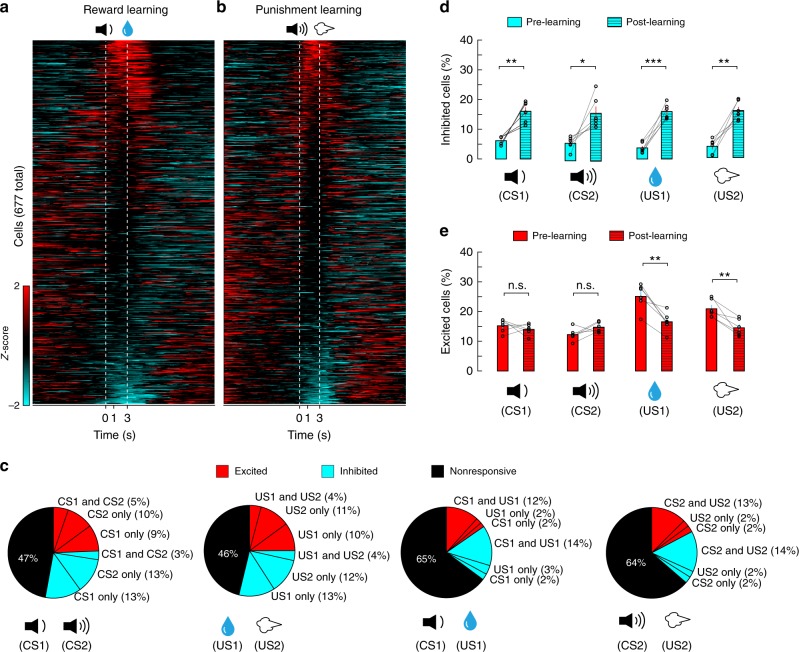
Fig. 3.
The CS and US responses in BLA neurons after learning. BLA neuronal activities were imaged in mice (n = 6) well trained with both the reward and the punishment conditioning. a Left: heatmaps of activities (z-scores) for all neurons (n = 677) in the reward block, in which CS1 was paired with US1 (indicated by the dashed lines). Each row represents the temporal activities of one neuron. Neurons are sorted according to their average z-scores during the 0–1 s time window. b Same as (a), except that imaging was performed in the punishment block, in which CS2 was paired with US2. c Pie charts showing the percent distributions of neurons responsive to different stimuli after learning. Note that at this stage, inhibitory responses became prominent; and the percentage of neurons responsive to both CS1 and US1, or to both CS2 and US2 increased. d Proportions of BLA neurons showing inhibitory responses to the CSs and USs before and after learning (N = 6 mice; CS1, t(5) = −5.075, **P = 0.0039; CS2, t(5) = −3.393, *P = 0.0194; US1, t(5) = −9.413, ***P = 2.28e−4; US2, t(5) = −5.886, **P = 0.002; paired t-test). e Proportions of BLA neurons showing excitatory responses to the CSs and USs before and after learning (CS1, t(5) = 0.83, P = 0.44; CS2, t(5) = −1.18, P = 0.29; US1, t(5) = 5.24, **P = 0.003; US2, t(5) = 4.194, **P = 0.008; paired t-test)

