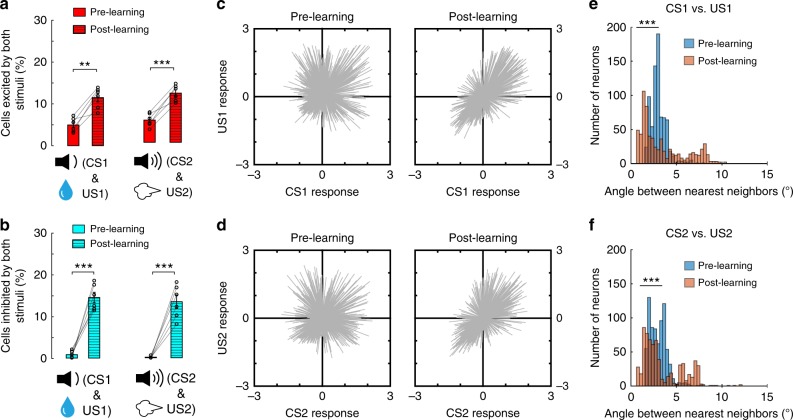
Fig. 5.
Learning links CS and US representations in the BLA. a The percentage of BLA neurons showing excitatory responses to both CS and US (n = 6 mice; CS1 & US1, t(5) = −6.116, **P = 0.0017; CS2 and US2, t(5) = −9.2, ***P = 2.5e−4; paired t-test). b The percentage of BLA neurons showing inhibitory responses to both CS and US (n = 6 mice; CS1 and US1, t(5) = −8.8, ***P = 3.12e−4; CS2 and US2, t(5) = −8.3, ***P = 4.11e−4; paired t-test). c, d The responses to CS1 and US1 (c), or to CS2 and US2 (d), for each neuron. Each line is a vector representing the responses of a particular neuron to both the CS and the US (values represent z-scores). Note that before learning, the vectors are distributed uniformly in the four quadrants, whereas after learning, the vectors are more concentrated in quadrants I and III. e The distribution of angles between the nearest neighbors among vectors in (c) (pre-learning median, 3.89, n = 756 neurons, post-learning median, 2.36, n = 677 neurons, z = 4.73, ***P = 2.26e−6, rank sum test). f The distribution of angles between the nearest neighbors among vectors in (d) (pre-learning median, 3.93, n = 756 neurons, post-learning median, 2.60, n = 677 neurons, z = 5.3, ***P = 1.42e−7, rank sum test)

