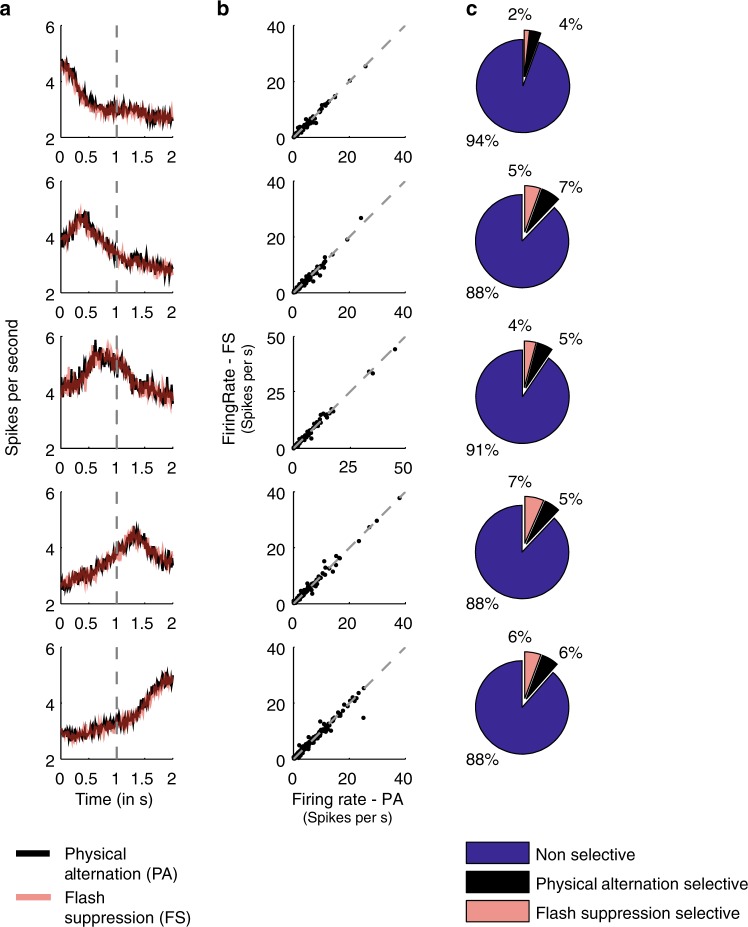
Fig. 4.
Single unit population activity. a Average population activity across all single units assigned similar to a given response profile in Fig. 3, during the condition of PA (black) and FS (pink). Note that the average activity is similar across the two conditions. b Scatter plot of the average firing rate of each single unit in the same cluster during the second part of the trial (1001–2000 ms). c Percentage of units (rounded to integers) which fired significantly higher in the physical alternation (black) or flash suppression (pink) condition. A majority of the units did not fire significantly different in either of the stimulus conditions (blue) (rank sum test, p > 0.05). Refer to the text for the exact number of units assigned to each CRP

