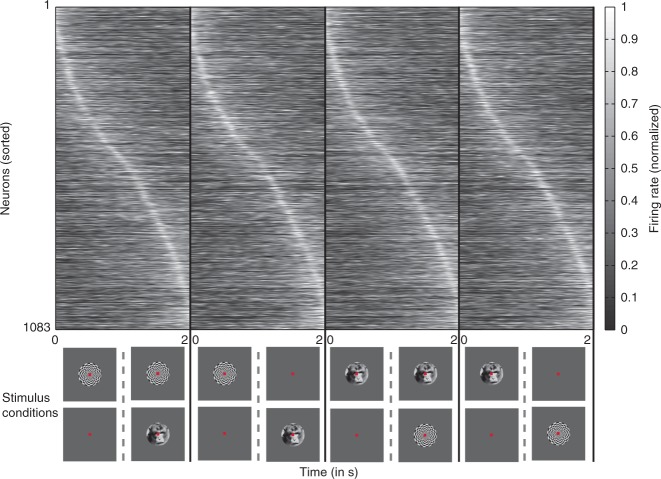
Fig. 5.
Single unit activity sorted according to the latency of the peak neuronal response. Each top panel displays the neuronal activity in the different stimulus conditions (shown in the bottom panel) sorted according to the latency of the peak amplitude. For determining the sorting order, the average PSTH across the four conditions was calculated, peak latency for the resultant PSTH was determined and neurons were sorted accordingly. Neurons tend to peak around the same time across the four stimulus conditions. Moreover, the peaks are distributed across the entire duration of the trial

