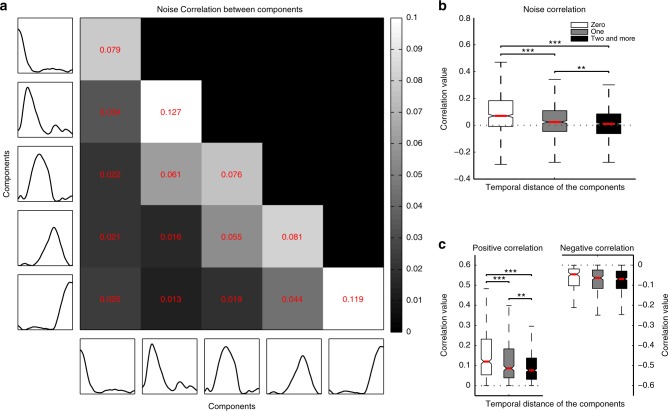
Fig. 6.
Noise correlation matrix and whisker box plots of correlations as a function of temporal distance. a Correlations were calculated across various combinations of neurons assigned to the sequential CRPs (arranged chronologically with earliest on the top and latest on the bottom along the y axis and earliest at the left most position and latest on the right most position on the x-axis). The brightness of the individual pixels depict the strength of correlation according to the colorbar on the right, with white and black depicting high and low correlations, respectively. Strong correlations were observed between neurons lying on the major diagonal, which constitutes contemporaneous neurons. The correlations decreased as depicted from the intensity of pixels across successive diagonals lateral to the main diagonal. Correlations in these consecutive diagonals are obtained from pairs of units classified to successive, temporally separated patterns (temporal distance of one, or two and more in b and c refers, respectively, to the first, or the second and the rest of the neighboring diagonals toward the left of the main diagonal). b Whisker box plots of noise correlations for different groups of neuronal pairs according to the temporal distance between the components they are clustered to. The red line denotes median, and the box denotes the 25th (Q1) and 75th percentiles (Q3) of the data. Contained within upper and lower whisker lengths are all adjacent values within Q3 + 1.5×(Q3−Q1) and Q1−1.5×(Q3−Q1), respectively. Notches approximate the 95% confidence interval around the median, and its edges are calculated as median ± 1.57 (Q3−Q1)/(square root of number of samples). Correlations decreased with an increase in the temporal distance between the CRPs to which the constituent single units were clustered to. c Whisker box plots of positive correlations displayed a trend very similar to the correlations in b. Whisker box plots of negative correlations which were not significantly modulated by temporal distance. In figures b and c, t-test (for sample numbers, refer to Supplementary Fig. 5) is utilized for comparison, *p ≤ 0.05, **p ≤ 0.01, ***p ≤ 0.001. See also Supplementary Fig. 6

