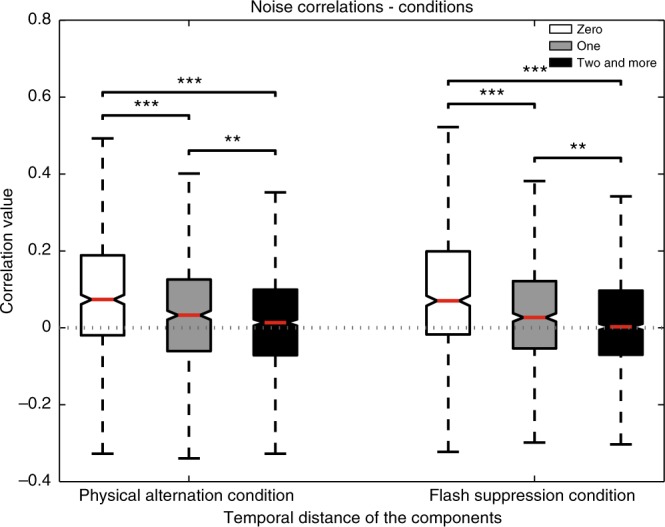
Fig. 7.

Noise correlations as a function of temporal distance for the PA and FS condition. The box plot referred to as zero, constitutes correlations among units clustered to the same CRP. Temporal distance of one, or two and more refers, respectively, to the first, or the second and the rest of the neighboring diagonals toward the left of the main diagonal as displayed in Fig. 6. Parameters for box plots similar to as in Fig. 6. Average noise correlations displayed a decrease as a function of temporal distance for both the PA as well as the FS conditions (t-test, *p ≤ 0.05, **p ≤ 0.01, ***p ≤ 0.001)
